EU Gas Consumption and Production in Q1 2020
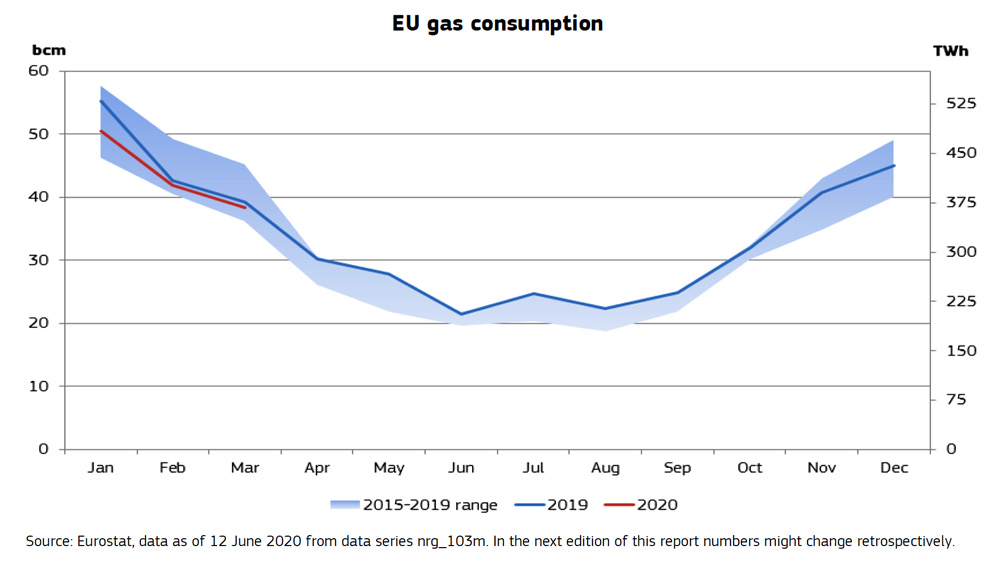
In the first quarter of 2020 EU gas consumption decreased by 5% in year-on-year comparison, in contrast to the increases in the previous two quarters (7% and 2%). Gas-fired electricity generation slightly decreased (by 2%, year-on-year), and milder than usual weather reduced heating needs in most of the EU countries. In absolute numbers, gas consumption in Q1 2020 amounted to 131 bcm.
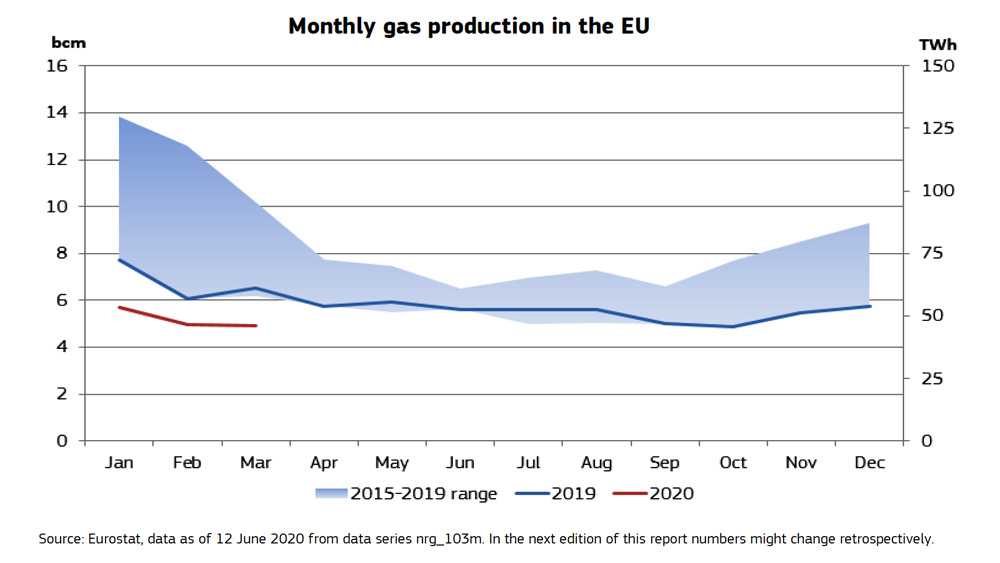
EU gas production fell by 23% year-on-year in the first quarter of 2020; amounting to less than 16 bcm. Gas production decreased in the biggest EU gas producing countries, including the Netherlands (-33%, the steepest fall in the last six years) and in Romania (-5%). In Q1 2020 Netherlands produced 7.2 bcm of gas, Romania had a production of 2.5 bcm, followed by Germany (1.3 bcm) and Italy (1.1 bcm), respectively down from 10.6 bcm, 2.6 bcm, 1.5 bcm and 1.3 bcm measured in Q1 2019. Decreasing EU gas production points to increasing gas import dependency, which is expected to rise further after the withdrawal of the UK. In 2018 the EU external gas import dependency was 83% (whereas with the UK it was less, only 77%).
EU net gas imports fell by 7% in the first quarter of 2020, compared to Q1 2019. In Q1 2020 the amount of net gas imports (81 bcm) and domestic gas production (16 bcm) did not fully cover the quarterly gas consumption of 131 bcm, in the heating season storages (net decrease by 34 bcm) were also used. Pipeline gas imports from Russia fell by 23% year-on-year in Q1 2020, whereas pipeline imports from Norway decreased by 4%. Algerian pipeline gas imports fell steeply, by 38% compared to Q1 2019, driven by uncompetitive oil-indexed prices and increasing domestic gas demand in the country, implying less export opportunities. Pipeline gas import from Libya, having only a small share in EU imports, also fell by 15%.
Russian pipeline supplies remained the main source of EU gas imports, covering 40% of extra-EU imports in Q1 2020, which represents the lowest share in the last six years.
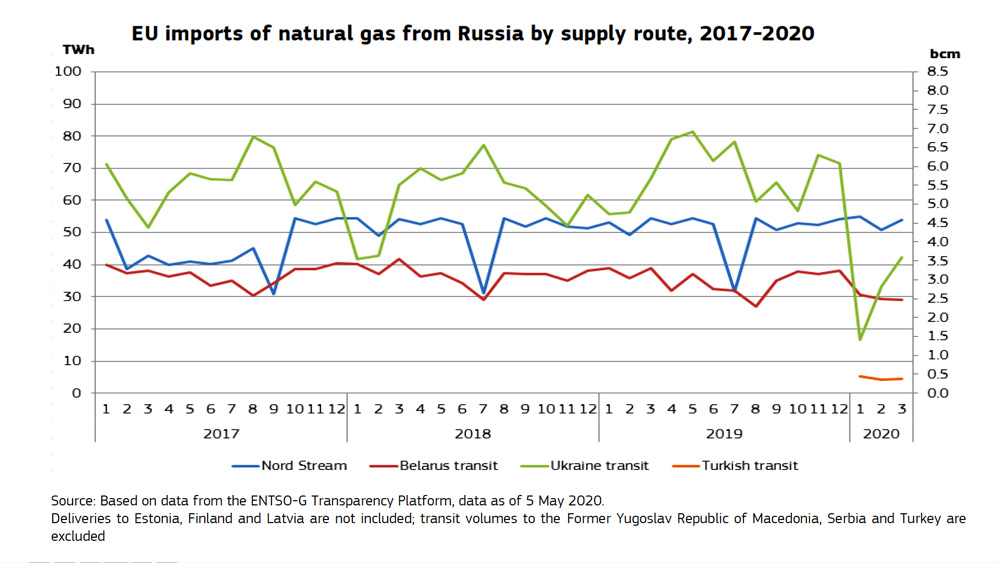
In the first quarter of 2020, Nord Stream became the main supply route of Russian gas to the EU, as transit through Ukraine fell substantially. Nord Stream covered 45% of the total Russian supplies (around 15 bcm), up by 10 percentage points compared to in Q1 2019. The share of the Ukrainian transit route fell to 26% (8 bcm) down by 14 percentage points in year-on year comparison. In Q1 2020 the amount of gas transited through Ukraine fell by 49% year-on-year, especially steeply falling in January 2020, when the transit volume was only 1.4 bcm, compared to the 2019 monthly average of 5.7 bcm. Some traders indicated that Gazprom sold gas during this period from European storages, using the Electronic Sales Platform (ESP), rather using the Ukrainian transit route. On the top of this, the Trans Balkan pipeline is no longer supplied through the Ukrainian transit, rather through the TurkStream. With the inauguration of the EUGAL pipeline, linking the Baltic Sea region (Nord Stream) with German and Czech customers, the direction of gas flows in Central Europe might change, which also explains why the share of the Ukrainian transit went down in Q1 2020. However, according to the agreement on Ukrainian transit signed at the end of 2019, the minimum transit volume through Ukraine should reach 65 bcm this year. In Q1 2020 gas supplies transiting Belarus also fell by 22% compared to Q1 2019, and covered 25% (8 bcm) within the total EU imports from Russia. As of 8 January 2020, the TurkStream is operational, its share in the Russian gas transit was around 4% in Q1 2020, and around 1.2 bcm gas was shipped via this route to the EU.
On 30 March 2020 the Arbitral Tribunal in Stockholm has ruled in favour of the Polish oil and gas company PGNiG, thus ending a five-year long dispute between PGNiG and the Russian Gazprom concerning the price of gas. The Russian company was required to pay back to PGNiG an estimated USD 1.5 billion (around EUR 1.3 billion), which is the difference between the price calculated based on the new formula and the amounts actually paid by PGNiG between 1 November 2014 until 29 February 2020.
In March 2020 Bulgaria achieved a 40% cut in the price of gas it imports under its long-term contract with Russia, after the European Commission finalised an antitrust investigation against Gazprom in 2018 by way of commitments. The price cut was achieved, after Gazprom agreed to link a significant part of the price to European gas hubs.
Gas storage levels in the EU stood at 54% at the end of March 2020, which was highest in the last nine years at this time end of the year. Gas withdrawals in Q1 2020 amounted to 34% of the total storage capacity, as opposed to 30% in the first quarter of 2019. Intensive storage withdrawal activity also contributed to the oversupply on many European gas markets. In many cases, traders anticipated lower prices for the near future, which prompted selling the gas from the storages. At the end March 2020, the EU average storage-filling rate was 13 percentage points higher than a year before, implying less injection needs in the following two quarters during the summer filling season.
EU gas consumption in the first quarter of 2020
EU gas consumption in the first quarter of 2020 decreased by 5% in year-on-year comparison, after going up by respectively by 7% and 2% in the previous two quarters. In absolute numbers, the quarterly gas consumption in Q1 2020 amounted to an estimated 130.8 bcm, increasing from Q4 2019 (117.7 bcm), but down from (137.1 bcm) in Q1 2019. Gas-fired electricity generation showed a minor year-on-year decrease in Q1 2020 (decreasing by 1.8%, or 2.4 TWh), reversing the growing trend observed in earlier quarters in many European countries. Weather across Europe was generally warmer in January-March 2020 compared to the seasonal average, resulting in less heating-related demand for gas in the residential sector. The decrease in gas demand in the electricity generation sector was aggravated by the decreasing industrial demand induced by the Covid-19 lockdown measures in the last weeks of the quarter. However, during the whole Q1 2020 gas consumption was in the range of 2014-2019, close to the lower end of the range.
In the first quarter of 2020, the biggest year-on-year increase in gas consumption could be observed in Malta (20%, though representing only a minor increase of 0.02 bcm). Gas consumption went up in Portugal (by 17%, 0.2 bcm) and in Hungary and Croatia (4% in both, and respectively by 0.2 bcm and 0.04 bcm) and the Netherlands (by 3% and 0.4 bcm, which latter represented the biggest increase in consumption volume in the EU). Gas consumption decreased Q1 2020 by more than 20% in in Romania, Latvia, Finland and Slovakia, whereas in Estonia it also fell by 14% in year-on-year comparison. In the United Kingdom consumption of natural gas decreased by 4.5% (1.2 bcm) in Q1 2020 compared to the first quarter of 2019.
In absolute numbers, gas consumption in Q1 2020 decreased the most in Germany and Italy (both by 1.7 bcm), Romania (1.3 bcm), France (1.1 bcm), Slovakia (0.4 bcm), Spain (0.3 bcm), and Finland (0.2 bcm).
Besides the aforementioned mild weather conditions and decreasing use in electricity generation, natural gas demand also decreased in the industrial sector. Starting at the end of February in Italy, and by the end of March gradually expanding in whole Europe, confinement measures, severely impacting movement of persons and economic activity, were introduced in order to curb the spreading the Covid-19 coronavirus, which has already impacted other parts of the world (especially China in Asia) since the beginning of 2020. Looking at the year-on-year change in gas consumption in March 2020, in Italy and Spain, both heavily impacted by the confinement measures, a decrease of 4% and 6% could be observed.
Based on data from ENTSO-E, gas-fired power generation was down by 1.8% in the first quarter of 2020, compared to the same period of 2019. In absolute terms, electricity generated from gas decreased by 2.8 TWh year-on-year. In Q1 2020 gas wholesale prices turned down again in Europe, which could have been beneficial for gas use in power generation. However, besides the demand related impact, stemming from mild weather conditions and limited demand for gas in the industry, in Q1 2020 the role of renewables in the EU power generation mix was particularly strong, leaving not too much room for gas in spite of decreasing fuel costs. Solar and wind generation in the EU was up, respectively by 84% and 19% in Q1 2020, compared to the first quarter of 2019, and solid fuels continued their falling trend, decreasing by 30% over the same period. Although carbon prices decreased measurably in Q1 2020, reaching 22.8 EUR/tCO2e on average, this could not improve the competitiveness of fossil fuels, especially that of coal and lignite in power generation in the EU.
In Q1 2020 the amount of electricity generated from gas went down by 6% in year-on-year comparison in Spain, Italy and France, in Germany it decreased by 2%, whereas in the Netherlands it rose by 3%, owing to changes in the local power generation mixes. Rise in electricity generation from hydro contributed to the replacement of gas in the local mixes in Spain, Italy and France. At the same time, increasing wind power generation in France and Germany had an important role, and increasing solar power generation in Germany and Spain helped in reducing the role of natural gas, too. Generation from solid fuels showed a double-digit fall in each of these aforementioned countries, and generation from nuclear decreased as well in France and Germany. In Portugal gas-fired generation was up by 51%, and along with significantly increasing hydro it compensated the fall of coal-fired generation, practically disappearing from the local power mix. In Italy and Spain generation from gas was respectively down by 19% and 20% in March 2020 year-on-year, showing the impact of the economic downturn and confinement measures related to the lockdown.
EU gas production in the first quarter of 2020
In the first quarter of 2020 EU gas production reached approximately 15.6 bcm8, 23% (4.8 bcm) less than in the same quarter of 2019. During the whole Q1 2020 gas output was below the 2015-2019 range, reflecting the dwindling trend of gas production in the EU. Five years before, in Q1 2015 the total gas production in the EU was still 36.6 bcm, more than twice as high as in the first quarter of 2020, implying the rapidly decreasing gas production in the block of 27, and increasing import dependency in natural gas.
In the biggest EU producer Netherlands natural gas production in Q1 2020 decreased by 33% (3.5 bcm). The production gap for the biggest Groningen gas field was set to 11.8 bcm for the gas year 2019 (started in last October), which is significantly down from the actual production of the preceding gas year (17.5 bcm, which was also less than the allowed maximum). Beyond the decrease from Groningen field, smaller gas fields produced 2 bcm less gas in 2019 than a year before, indicating the rapid fall in Dutch domestic gas production.
In Romania, being the second biggest gas producer in the EU, production went down by 5% (0.1 bcm). Gas output in Denmark showed a very strong decrease (by 57%, 0.5 bcm year-on-year, principally owing to the suspension of production at the Tyra fields in the Danish North Sea, ahead of the redevelopment until 2022), and in Germany, Italy and Ireland production went down by 0.2 bcm each (in percentage change respectively by 13%, 17% and 20%). Looking at the biggest EU gas producers, in Q1 2020 Netherlands produced 7.2 bcm, Romania had a production of 2.5 bcm, followed by Germany (1.3 bcm) and Italy (1.1 bcm).
The United Kingdom managed to slightly increase (by 1%, 0.1 bcm) its gas production in Q1 2020 to 10.4 bcm, whereas in Norway gas production decreased by 3.4%, from 32.1 bcm in Q1 2019 to 31.1 bcm in Q1 2020.
Imports
According to Eurostat, net imports decreased by 6% in the first quarter of 2020 (year-on-year), mainly driven by 5% reduction (year-on-year) of the EU gas demand. Net imports in different EU countries showed a high variation in Q1 2020, ranging from a decrease of 46% (in Austria) to an increase of 217% (in Malta, though by marginal value, 0.1 bcm) in year-on-year comparison. Among big gas consumer countries net imports decreased in the France (by 25%), Poland (12%), in Italy (9%), Germany (8%) and Spain (4%). Net imports increased slightly in Greece (by 4%) and Romania (1%).
In the first quarter of 2020, the total net extra-EU gas imports reached 80.9 bcm, down by 7% from 86.9 bcm in the same period of 2019. The five biggest importers in the EU in Q1 2020 were Germany (24 bcm), Italy (16 bcm), France and Spain (both 8 bcm) and Belgium (6 bcm), representing together close to 80% of the total EU net gas imports in Q1 2020. After the United Kingdom left the European Union, the gas import dependency of the EU-27 increased further. In 2018 import dependency stood at 83.2% (with the UK, being a significant gas producer, the import dependency was 77.4% in 2018, as Eurostat data show).
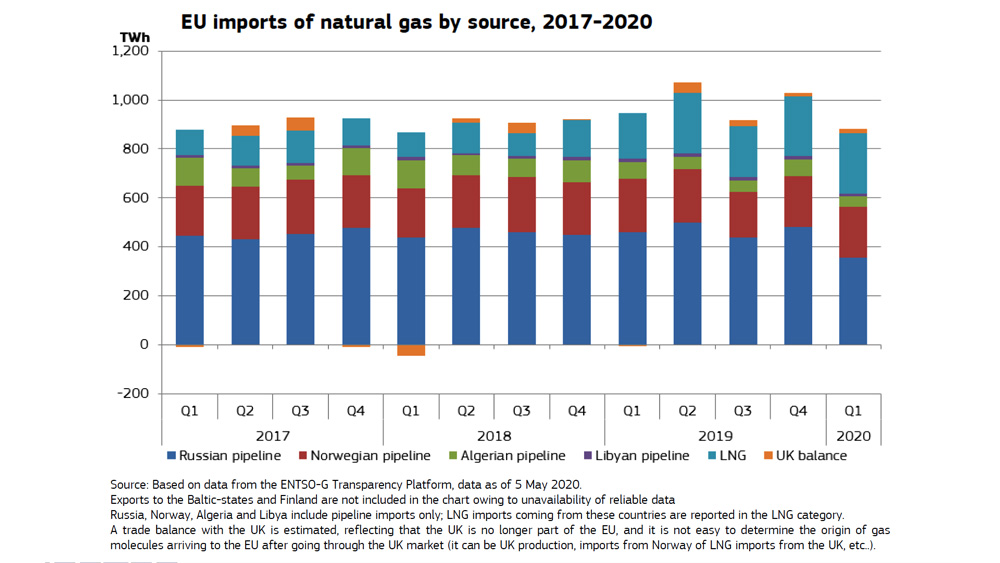
According to ENTSO-G data, imports amounted to 881 TWh in the first quarter of 2020, of which 72% through pipelines and 28% through LNG terminals. Pipeline gas Imports from Russia fell significantly, by 23% in year-on-year comparison, principally owing to the big decrease in January through the Ukrainian transit route. Pipeline gas imports from Algeria fell further in Q1 2020 (by 38%), imports from Norway decreased only by 4% in Q1 2020, whereas from Libya it went down by 15% in year-on-year comparison. At the same time, LNG imports, though in a slower pace than in 2019, increased further year-on-year, and reached 248 TWh in Q1 2020.
Russia remained the top gas supplier of the EU, however, the share of Russian pipeline gas in the extra-EU gas imports fell to 40% in the first quarter of 2020, which was the lowest in the last six years. In Q1 2019 the share of Russian pipeline gas imports was almost 49%. As pipeline gas imports from Norway decreased only by 4% year-on-year in the first quarter of 2020, which was slightly less than the total gas decrease (5%), the country’s share in extra-EU gas imports remained practically the same, 24%12, compared to Q1 2019. In the first quarter of 2020 Norwegian gas production13 amounted to 31.1 bcm in Q1 2020, decreasing by 3.4% year-on-year. However, Norwegian gas production has relatively low costs (estimated to be around 2 USD/mmBTU, around 6-6.5 EUR/MWh in Q1 2020), which still ensured profitability for exporting gas to Europe. In the first quarter of 2020 pipeline gas imports from Algeria continued to fall, decreasing by 38% year-on-year, which resulted in a falling share within the total extra-EU imports (5% in Q1 2020 vs. 7.5% in Q1 2019). This was probably owing to increasing domestic gas use in the country (implying less export opportunities), and the uncompetitive nature of the still-significant oil indexed contracts in Algerian gas exports. Imports from Libya turned down again (-15% in Q1 2020 compared to the same period of the previous year), and its share was only 1.3% in the total EU gas imports.
Due decreasing import volumes and falling average import prices, in the first quarter of 2020 the estimated gas import bill fell below EUR 10 billion for the first time in the last six years (amounting to EUR 9.8 bn in Q1 2020, down from EUR 14.4 billion in Q4 2019 and from EUR 18.7 billion in Q1 2019, falling by 48% year-on-year).
Pipeline imports from Russia and EU supply to Ukraine
In the first quarter of 2020 the volume of Russian imports fell by 23%, if compared with the same quarter of 2019. The steepest fall could be observed in January 2020, when Russian pipeline imports fell by 29% year-on-year. Gas flows transiting Ukraine were almost 49% lower than in Q1 2019. In January 2020 only 1.4 bcm gas of Russian origin was transited through Ukraine, whereas in 2019 the average monthly transit volume was 5.7 bcm. Some market traders indicated that Gazprom might have sold gas volumes stored in EU countries to serve European customers rather than using the Ukrainian transit route, albeit the five-year transit agreement was concluded at the end of 2019. In February and March 2020, albeit slightly recovering, gas imports through the Ukrainian transit route was still down by 35-40% in year-on-year comparison.
Flows through Belarus were also down significantly, by 22% in Q1 2020 compared to the same quarter of 2019. In contrast, gas flows through the Nord Stream managed to rise slightly, by 2% in Q1 2020 in year-on-year comparison.
As a result, in Q1 2020 the share of the transit through Ukraine fell measurably, and reached only 26%, compared to 40% in Q1 2019. Nord Stream became the main supply route of Russian gas to Europe, as its share reached 45% of the total Russian pipeline gas imports in Q1 2020 in the EU, up from 35% a year earlier. The Belarus transit route represented 25% in Q1 2020, practically the same as in Q1 2019. As of 8 January 2020, the TurkStream is operational, its share was around 4% in Q1 2020, and around 1.2 bcm gas was shipped via this transit route to the EU. In Q1 2020 Nord Stream represented 18% (15 bcm) in the total net extra-EU imports, the Ukraine had a share of 10% (8 bcm), and the Belarus transit route ensured 10% (8 bcm), whereas the TurkStream had a share of less than 2%, with slightly more than 1 bcm gas transit within the total net extra-EU gas imports in Q1 2020.
This implies that decreasing pipeline imports from Russia, which was partly due to the increasing share of LNG in the European gas market, was less transited through Ukraine, in spite of the existing agreement for the period of 2020-2024, setting a minimum amount of Russian gas transit through the country (65 bcm for 2020). The Trans Balkan pipeline, which transited Russian gas to the countries of the Balkans coming from the Ukrainian route, now operates as route for the Russian gas coming through the TurkStream.
In the first quarter of 2020, similarly to the preceding years, Ukrainian natural gas imports from EU countries started to recover after dropping close to zero during the autumn months at the end of the storage injection season. However, it seems than in the first three months of 2020 gas imports in Ukraine increased more rapidly than in the preceding years. In Q1 2020 total gas imports from Poland, Slovakia and Hungary amounted to 2.2 bcm, up from 0.9 bcm in Q1 2019. In Q1 2020 1.7 bcm natural gas came from Slovakia, while amounts from Hungary and Poland were respectively 0.4 bcm and 0.1 bcm. Higher amounts of Ukrainian imports were probably due to low spot market prices and mild winter conditions, implying that it was more profitable to import gas from EU countries than relying on withdrawals from underground gas storages.
Meanwhile Gazprom sold an amount of 3.8 bcm natural gas in January 2020 through its Electronic Sales Platfrom (ESP), which was the highest since the creation of the platform in September 2018. Around 11% of Gazprom’s European sales were executed in this month though the ESP or hub trading, mainly selling the gas stored in European storages, with principal delivery points on the German Gaspool market, on the delivery point Arnoldstein at the border of Austria and Italy and on the delivery point Beregovo on the Hungarian-Ukrainian border. In February 2020 The ESP traded volumes were still significant, amounting to 2.4 bcm, concentrating principally on month-ahead and season-ahead contracts, whereas the bulk of sales in January was linked to spot contracts.


