


Global oil market dynamics
The second half of 2017 has brought about a positive context for oil prices. The agreement between OPEC members and the major non-OPEC producers seems to have succeeded in stabilizing the price, and the global economy is in full swing, providing the fundamentals for continued growth demand. Optimism is also clear from the positioning of the big financial players, which in July and August increased their bets on the oil price increase. On the other hand, the signatories of the OPEC agreement fail or simply (no longer!) want to meet the targets in terms of output cuts, whereas the volumes brought on the world market by US producers of ‘shale oil’ are higher. The unseen tensions on the market are increasingly obvious, and the positive outlook given by the hopes of stabilizing oil prices at high levels does not seem to be too clear anymore.
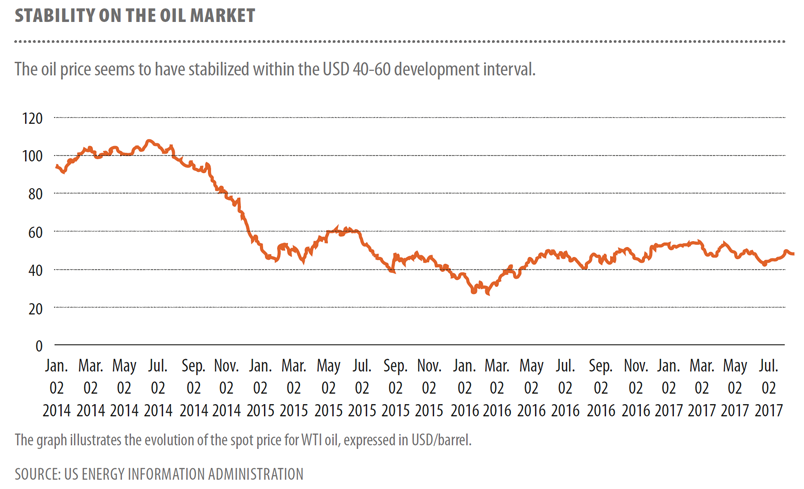
Against the end of the first half, the WTI spot prices grew by about 18% at the end of July and by about 10% in mid-August; Brent oil evolved in about the same parameters. The advance, amid a series of news and information from the United States, was bringing the oil price to the upper limit of the development channel formed between the thresholds of USD 40 and USD 60 per barrel, where the oil is traded since mid-2016, which confirms the idea that the oil price has reached a balance, bringing a further drop of optimism to those expecting future price rises (see the graph ‘Stability on the oil market’).
Short term support
The figures that triggered this positive price development are therefore elements of support to the market stabilization process determined by the OPEC agreements. However, it should be noted that some of these figures seem to have a short-term impact potential. Good examples in this regard could be the statistics published by Baker Hughes for the end of August, which reveal the existence of a cap on the upward trend of the number of oil drilling rigs in operation… or the figures revealing repeated decreases, larger than the expectations, of the US oil reserves. Both types of information are likely to support the price increase! They are also relevant as a trend, but relatively easily reversible. The same is true for the data showing that the US refiners’ oil demand remains higher than expected, whereas the oil held in reserves is not of adequate quality, or the news of the closure of one of the largest oil fields in Libya. All these, however, contributed to the upward momentum of oil price at the beginning of the second half of the year, although they did not have the capability to support this trend over a longer period.
Long term support
In parallel, a number of information, relevant through the effects they can have over the medium and long term, have appeared! One of these is the BHP Billiton decision to abandon the shale exploitation operations; a fact that questions the capacity of the US shale industry to support the continued growth of production, and thus a sign of reducing supply pressure in the future. This comes because we are talking about the field that has brought the boom to the US oil production. The BHP step is relevant as a medium to long-term signal, also because the decision was made as a result of lower-than-expected financial results – an alarm signal for other players in the industry. It is an alarm signal which already has confirmation in the figures showing that the Wall Street has rather lost appetite for financing the exploration and exploitation of shale deposits.
Thus, for June 2017 (the end of the first half), a series of statistics delivered by specialized financial players show that the companies operating shale oil and gas fields have been able to attract from the US capital market only about USD 3 billion to fund new drilling operations. The figures reveal a major change in investors’ perception as, one month ago, they were pulling out of their pockets, for only two of the companies that had such deals (Kosmos Energy and RSP Permian) more than USD 1 billion. These figures may be an indication of limiting the potential for new oil drilling rigs to be put into operation and thus of lower global pressure on the supply side… which may be a driver of price increases.
The series of figures that have the capacity to support a possible upward trend in oil prices over the long term is complemented by news of a possible new prolongation of the OPEC states’ agreement. The Iranian Oil Minister’s statement is one of these: “We are in talks with OPEC members to make a decision… but making a decision within the organization is difficult because whichever it may be, it involves cuts of the members’ output,” the official said at the end of June, saying on one hand that there are discussions and, on the other hand, they target a new round of production cuts.
Macro-economic favourable context
Therefore, more than a few figures support the prospects of rising oil prices! And the most important issue is that a favourable evolution of the global economy overlaps these, which brings with it an important support for the increase of the future demand.
According to World Bank forecast, the global economic growth will reach about 3.4% for 2017 and 2018, well above the level of 3% in 2016. At the same time, after an increase of only 1.7% in 2016, the OECD Member States’ GDP is expected to advance by about 2% both in 2017 and in 2018; at the same time, according to the same World Bank forecast, the large emerging economies either keep the economic growth at high rates (India) or perform better than expected (China) or are in full recovery from recession (as is the case of Russia and Brazil). The figures therefore show the existence of a favourable global macroeconomic context and the premises for a continuing positive economic development both for the end of 2017 and for 2018, which is all the more obvious for the world’s major economies.


The United States, for example, is on a vigorous upward trend: the GDP has grown by 1.5% in 2016, but the higher investment in the energy sector, higher consumption and the improved export situation has led to 2.1% economic growth expectations for 2017 and 2.2% for 2018. At the same time, the eurozone had an economic growth constantly better than the estimates for the past few quarters, amid a sustained monetary policy by the European Central Bank (ECB) and has a GDP growth forecast of 2% for 2017 and of 1.8% for 2018 (better against the 1.7% rate recorded in 2016). Moreover, the positive outlook for eurozone’s economic course is supported by the high probability of an improved labour market situation, following the decisions to be made in order to respond to the high unemployment rate.
On the other side of the world, Japan is also expected to increase the economic growth rate from 1% in 2016 to 1.4% in 2017 and to 1.1% in 2018, whereas China’s emerging economy has succeeded a development above expectations in H1 2017, having a 6.7% growth forecast for the entire year 2017 (similar to 2016) and of 6.3% for 2018. In the same club of emerging economies, India succeeded to digest the effects of restructuring measures (including the introduction of new taxes) and has an economic growth forecast of 7% for 2017 and 7,5% for 2018 – below the level of 2016 (7,9%), but still at a relatively high speed. At the same time, Brazil and Russia are expected to exit the recession cycle and to record growth rates of 0.5% and 1.2% respectively in 2017 – backed by the recovery in commodity prices and by the domestic consumption growth. For 2018, economic growth forecasts are 1.5% for Brazil and 1.4% for Russia.
Overall, the global macroeconomic context at mid-2017 indicates that not only the OECD economies, but also the emerging and developing economies will be in a significantly better situation at the end of 2017; the transmission of these positive macro-economic developments to simple citizens and an expected moderation in geopolitical tensions can thus provide even better than expected premises for the global economic development in 2018.
Interests’ growth positive effect
At the same time, arguments towards oil prices increase can be seen coming from the US Federal Reserve (Fed), in terms of the policy of raising the interest. This is because any increase in interest (meaning actually increasing the ‘price’ of money) leads to lower investments in the area of shale oil and gas exploitations in the United States – i.e. precisely in the area which, by the massive supply in the past decade, has contributed decisively to the drop in oil prices. At the same time, more expensive money (by tightening the monetary policies) also puts pressure on the increase in oil storage costs (by increasing them!), thus reducing the motivation to keep them at high rates (a high level is often a factor for downward pressure on oil prices). In conclusion, the tightening of the monetary policy could be an element in support of the oil price growth trend.
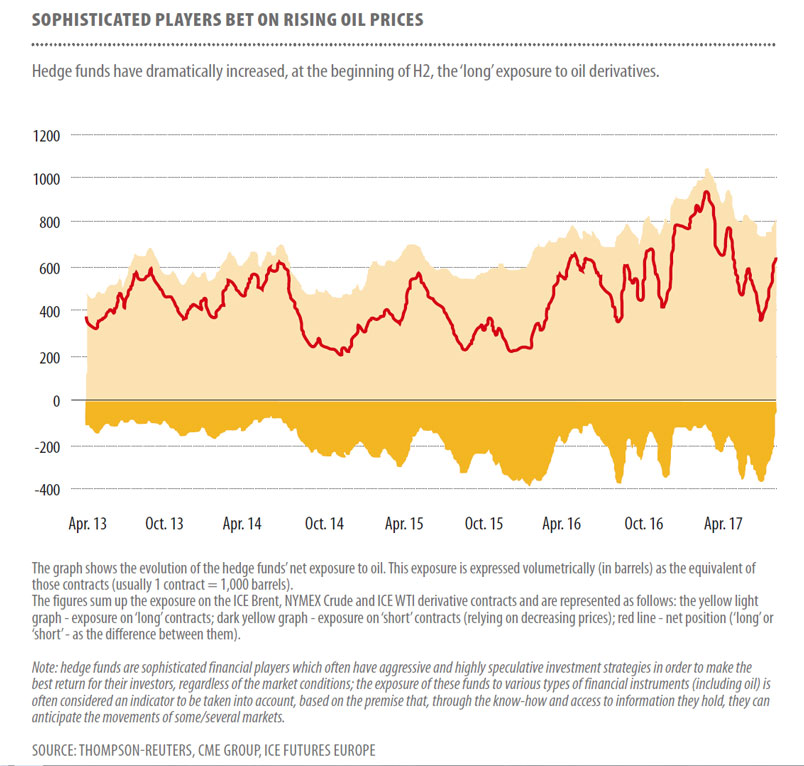
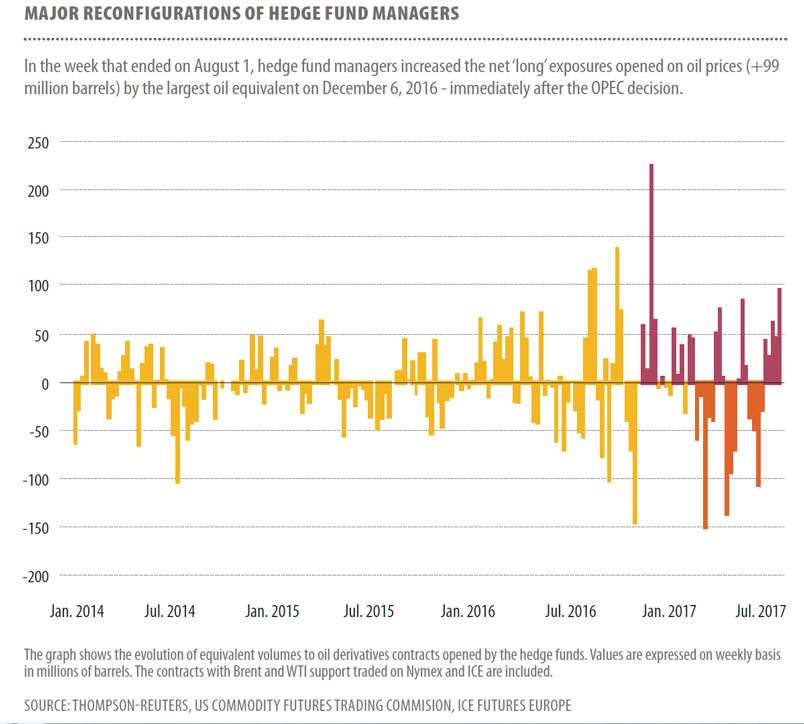
All of the above-mentioned elements therefore shape up the favourable context which, at the beginning of the second half of 2017, very likely has led to a major change in the big players’ perception on the financial markets, making them increase bets on the oil prices increase. We are talking about the so-called hedge funds (speculative investment funds) which, in the week which ended on August 1, reported a volume of net buy positions (‘long’ positions – relying on rising prices) open on oil derivatives, equivalent to 649 million barrels; by more than 290 million barrels more than at the end of June (at the end of the first half) and, at the same time, the highest level of the past three months (see the graph ‘Sophisticated players bet on rising oil prices’ and the graph ‘Major reconfigurations of hedge fund managers’).
The ratio between ‘long’ derivates contracts (which bet on rising oil price) and the ‘short’ ones (which bet on decreasing oil price) reached 4.5 at the beginning of August, up from a level of 1.95 at the end of June. The figures therefore express positive expectations among the sophisticated players about the future evolution of oil prices.
Weakening confidence
In addition to this dataset, positive figures and information, the beginning of the second half of 2017 also brings a number of elements that lead to weaker confidence in the sustainability of this context over the medium and long term. The first element could even be attributed to a possible adverse effect caused by the exit from the relaxed monetary policy cycle in the US (and/or perhaps also in the eurozone). Namely – an effect of inhibiting economic growth, which leads to the inhibition of consumption; not only for the developed economies, but mainly for the emerging and developing economies (economies that are highly dependent on cheap money flows) – precisely those economies that have consistently contributed to higher oil demand in the past years.
At the same time, also from financial perspective, another potential risk comes precisely from the large ratio between ‘long’ and ‘short’ positions, as it becomes increasingly difficult to maintain the positive trend; as higher oil price seems more sustainable, the more tempting it is for the producers to bring new blocks into operation, thus putting pressure on price. As hedge fund managers were wrong twice this year (in February and April were recorded maximum net buy-in positions, but the price turned backwards, causing portfolio losses), they will probably be more cautious from now on, which increases the risk of sales avalanche.
Many such vehicles have gone bankrupt this year, and the lessons are important. An important aspect in this regard is the one raised by Andy Hall (one of the world’s best-known oil traders) who, in a letter sent to investors at the closing down of the fund he managed, said: “if there’s the need for OPEC to discuss another extension of the production cuts agreement, it is actually a sign of weakness, not of power” – a very likely and fair perspective. Not only because the effects of the agreement seem to have the amplitude according to the importance of decisions… but mainly due to an increase in competition between the signatories, which is already visible in terms of compliance with the agreed output limits. Thus, OPEC’s effort to put an end to the situation of oversupply on the world oil market seems to be diluting.
According to statistics released by the organization in mid-August, July was the second consecutive month in which the degree of signatories’ compliance to the output capping agreement was below 90%; thus, if each of the OPEC members had assumed the production cuts by 1,164 thousand barrels, in June and July the production was reduced by only 978 and 1,004 thousand barrels respectively (84% and 86% respectively). It is to be noted that the degree of compliance among non-OPEC states is significantly lower than the one of the OPEC states, which shows that there are a number of divergent behaviours that can generate serious frustrations from those who see their efforts undermined by those who do not keep to the deal.
An overview of the global level highlights the fact that, while the major producers, as Saudi Arabia and Russia, are relatively close to meeting the agreed production limits… the small producers are less disciplined. Among them, countries such as Iraq, Algeria or Kazakhstan – which have expressed firm support for the gradual, but fast withdrawal, from this agreement.
It is true however, that the success or failure of the agreement could only be analysed after its conclusion – March 2018 (data for the whole period would be analysed), but the monthly developments point to current tensions that question the agreement’s real capacity to limit the oil oversupply. The reality of this risk (of non-compliance) was also noticed by the IEA (International Energy Agency, Paris based independent institution), who publicly expressed doubts on the firm commitment of the producers involved in the output cuts agreement.
The situation is much more complicated as the OPEC decisions can unbalance the market – which can do more harm! “OPEC steps on a very thin rope,” Ehsan Ul-Haq, director of a London-based oil and gas consultancy firm, said at the end of July. “If the oil price rises above USD 60 a barrel, then the shale oil producers quickly return to the market; if OPEC decides on a slightly more aggressive production cuts, prices will go beyond this threshold. On the other hand, if the signatories fail to meet their assumed obligations, the price will quickly go below the USD 50-barrel threshold,” he explained how hard it is to be in OPEC’s shoes now.
The United States’ menace
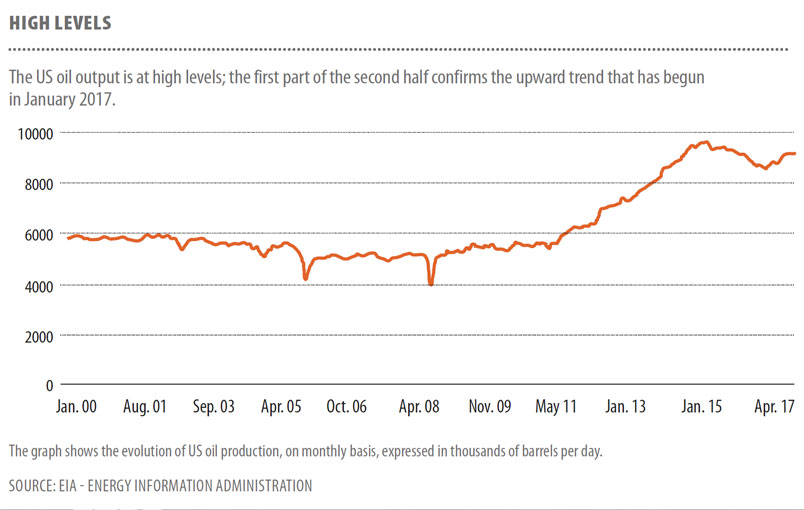
Beyond the potential problems between the signatories of the agreement, the OPEC members face the actual menace coming from the additional challenges brought by the US emergence as a relevant player on the market. The figures are not likely to calm the big traditional oil producers. At the beginning of August, the EIA (Energy Information Administration) has revised its estimates of the United States total oil production in 2017 and in 2018 (to 9.35 and 9.91 million barrels per day respectively, by 0.1% higher than the previous estimate) confirming that a strong upward trend in production has been maintained (see the graph ‘High levels’).
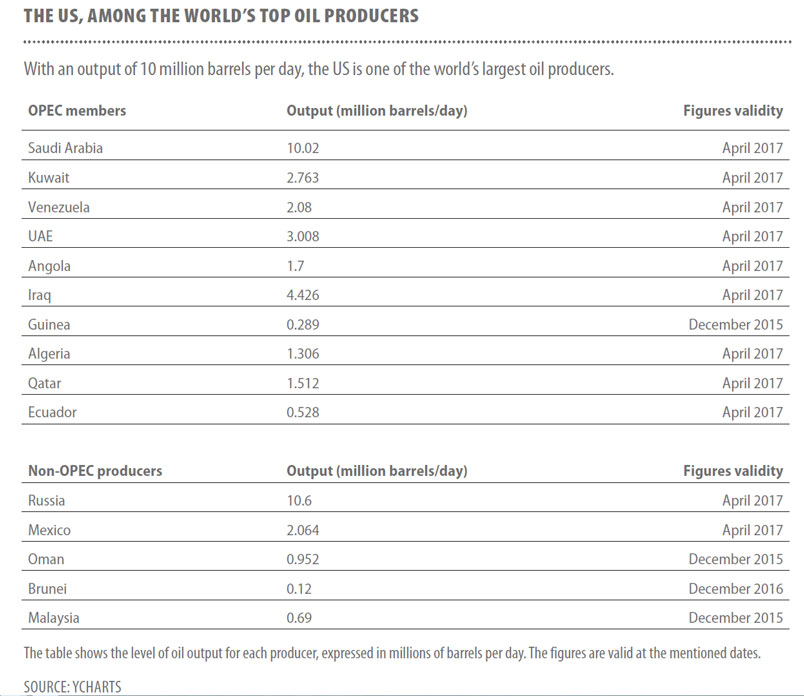
The figures also reveal that the United States is one of the top three largest oil producers worldwide (see the graph ‘The US, among the world’s top oil producers’), with a real capacity to influence supply and demand. An important part of the US industry is made up of ‘shale oil’ producers – which have not only a significant contribution to the output, but also a great flexibility. These things make the US not only a large player, but also a ‘swing producer’ – a characteristic of OPEC alone until a decade ago. This may be a threat to the current status quo, which is relatively convenient to OPEC, and to the prospects of oil prices… if the US would consider at some point that it is no longer interested to maintain it. In other words, we could easily imagine that at any time when the United States would like to put an end to the understanding around OPEC – by a relatively small effort to increase production, can trigger a true sales race between the signatories of the OPEC (as the falling prices would further affect their economic stability, shaken enough in recent years). Against this background, the EIA forecasts show that the US production of shale oil will continue to grow by another 117,000 barrels per day in September, confirming the increasing trend over the long term. Also relevant are the data showing that the number of bankruptcies in the United States oil and gas industry is on decline. According to Haynes & Boone law firm based in Dallas (the heart of the US oil industry), in the first half of 2017 only 14 companies started the bankruptcy procedure, much less against the same period in 2016, when 50 companies started this procedure. The explanation is that, on the one hand, the industry has received strong support from the rise in oil prices and, on the other hand, most of the weakened firms have already left the market, and only the assets that have the capacity to resist challenges have remained. The conclusion is, therefore, that we are talking about an increasingly strong American industry – capable of causing serious problems to the traditional oil producers.
Stability… For how long?
The second half of the year therefore brings a beneficial environment for most players on the world oil market. However, the series of pros and cons the future price increases makes this positive balance quite fragile; the forecasts made by the large financial players about the oil price can be worrying, as the revisions to the price targets for 2017 and 2018 are still down, albeit not very broad.
At the end of July, Credit Suisse cut the price forecast for 2020 by USD 5 per barrel, down from the USD 57.5 threshold. At the same time, Société Générale reduced the Brent oil price forecast for 2017 by USD 4.4 (from USD 52 per barrel) and by USD 6 (from USD 54 per barrel) against the previous one for 2018, roughly the same cuts being applied to the WTI oil price forecasts.
It is to be noted the Bank of America Merrill Lynch (BofA) more pessimistic view, in a report published at the end of the first half, which has reduced its price projections for 2017 and 2018 even below the USD 50 barrel. Thus, BofA forecasts for 2017 a WTI price of USD 47 per barrel and of USD 50 for 2018, down from USD 52 and respectively USD 53 per barrel as previously anticipated. In such a context, a sales race triggered by the failure to comply with the agreement to cut production by the signatories may start at any time. On the one hand, as a result of the pressures on the public budgets of those states; on the other hand, because the process of changing the economic development model (in the direction of shifting to alternative energy sources) makes oil deposits slowly but firmly lose value… while increasing the chances that a part of them (at least those whose exploitation is more expensive) to remain unexploited. Such a phenomenon stimulates their liquidation process as quickly as possible in order to obtain maximum revenues; for states in such a situation, maximizing means not only obtaining higher prices, but also liquidating as much as possible of the deposits held. This could bring the sales race debut closer and closer.