

Pollution and noise
The daily threats of modern society
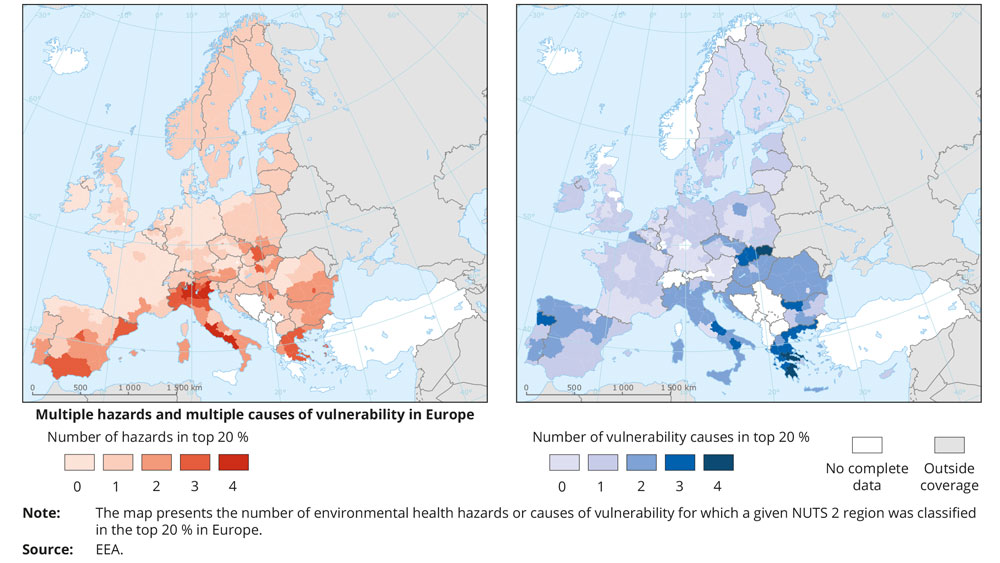
Targeted action is needed to better protect the poor, the elderly and children from environmental hazards like air and noise pollution and extreme temperatures, especially in Europe’s eastern and southern regions. A European Environment Agency (EEA) report recently published warns that the health of Europe’s most vulnerable citizens remains disproportionately affected by these hazards, despite overall improvements in Europe’s environmental quality.
The EEA report entitled ‘Unequal exposure and unequal impacts: social vulnerability to air pollution, noise and extreme temperatures in Europe’ draws attention to the close links between social and environmental problems across Europe. The distribution of these environmental threats and the impacts they have on human health closely mirror differences in income, unemployment and education levels across Europe. While EU policy and legislation over past decades have led to significant improvements in living conditions, both economically and in terms of environmental quality, regional inequalities persist. The report stresses that better alignment of social and environment policies and improved local action are needed to successfully tackle environmental justice issues. “The European Commission has consistently emphasised that, on environmental issues, we are a Europe that protects, according to the quoted report. That principle is best tested by examining how we protect the vulnerable, the weak and the defenceless. The European Environment Agency is to be commended for this report that examines how the poor, the old and the very young are those most at risk from poor air quality, excessive noise and extremes of temperatures. It informs our efforts to make sure that we are a Europe that protects all,” said Karmenu Vella, EU Commissioner for Environment, Maritime Affairs and Fisheries.
Most affected regions
The most affected areas with regard to air and noise pollution include the following.
- Eastern European regions (including Poland, Slovakia, Hungary, Romania and Bulgaria) and regions in Southern Europe (including Spain, Portugal, Italy and Greece), where incomes and education are lower and unemployment rates higher than European averages, were more exposed to air pollutants including particulate matter (PM) and ground level ozone (O3).
- Wealthier regions, including large cities, tend to have on average higher levels of nitrogen dioxide (NO2), mostly because of the high concentration of road traffic and economic activities. However, within these regions themselves, it is still the poorer communities that tend to be exposed to higher local levels of NO2.
- Exposure to noise is much more localised than exposure to air pollution and ambient levels vary considerably across short distances. The analysis did find a tentative link between noise levels in cities and lower household incomes, suggesting that cities with poorer populations have higher noise levels.
- Southern and south-eastern European regions are more affected by higher temperatures. Many regions in Bulgaria, Croatia, Greece, Italy, Portugal and Spain are also characterised by lower incomes and education, higher levels of unemployment and larger elderly populations. These socio-demographic factors can reduce individuals’ ability to respond to and avoid heat and thus result in negative health outcomes.
- In parts of Europe a large number of people are unable to keep their homes adequately warm because of poor-quality housing and the price of energy. Illnesses and fatalities associated with exposure to low temperatures continue to occur as a result.
Exposure of vulnerable groups to air pollution
There is abundant evidence emerging from various European locations on the associations between socio-economic status and air pollution. For example, nearly half of the most deprived neighbourhoods in London are exposed to NO2 values exceeding EU limits, compared with just 2% of the least deprived neighbourhoods. Similar observations on exposure to air pollution being higher for groups of lower socio-economic status were made in Dortmund, Germany, for PM10 and NO2, Ostrava, Czechia, Wales, Lille and Marseille, France (for NO2), Grenoble and Lyon, France, Wallonia, Belgium, Malta and the Netherlands. However, the association between socio-economic status and air pollution levels is highly location and scale specific. For example, research carried out in Sweden found that in some cities socio-economic status and the levels of NO2 in an area of residence are associated, but the associations vary considerably, even between cities in the same county. In Bristol, England, and Rotterdam, the Netherlands, the most and least deprived neighbourhoods were both exposed to similar concentrations of PM10 and NO2. This may be due to the desirability of city centre living among more affluent people. In Rome, people of higher socio-economic status were exposed to higher levels of NOx and PM10 because they lived in central city locations with high volumes of traffic. In addition, the type of settlement that vulnerable groups live in is associated with exposure to air pollution. For example, in Czechia, communities with lower levels of education and higher unemployment tended to reside in smaller cities with higher concentration levels of combustion-related air pollutants (SO2 and PM10), whereas those on higher salaries and with higher educational attainments tended to live in larger cities and were exposed to higher levels of NO2. In England, PM concentrations were found to be generally higher in areas of greater socio-economic deprivation; however, the pollution-deprivation relationships varied by urban-rural status. While some general conclusions can be drawn from local studies on the links between socio-economic status and air pollution exposure, they may not be equally applicable to all situations across Europe. There is limited and mixed evidence in terms of the exposure of older people and children to air pollution compared with the general population’s exposure. In the Spanish cities of Madrid and Barcelona, areas with higher numbers of children aged 0-4 were less exposed to NO2 compared with the city as a whole, while elderly people were exposed to higher levels of NO2, because of their over-representation in inner city neighbourhoods. A study in London did not find substantial differences in exposure to air pollution between under-19s or over-65s and the general population. Nonetheless, the exposure of children from groups of lower socio-economic status is particularly concerning on account of cumulative vulnerability factors potentially exacerbating the health impacts of air pollution. In London, over 85% of the schools most affected by poor air quality had pupils who lived in areas more deprived than the London average. In Malmö, Sweden, exposure of children aged 7-15 to NO2 in their place of residence and at school regularly increased as the socio-economic status of a child’s neighbourhood decreased. Thus, socio-economic status tends to be linked to exposure and vulnerability, while age factors, although they affect vulnerability, are not so strongly linked to exposure in the place of residence, the document quoted.
Impacts of noise on health
Exposure to environmental noise affects health through complex psychological and physiological pathways and it has been linked to a number of health outcomes, such as cardiovascular and metabolic effects, poor sleep and annoyance in adults, as well as to cognitive impairment in children. Possible explanations for the most severe effects of noise on health, such as those on the heart and circulatory system, are stress and a decrease in sleep quality. According to the World Health Organization (WHO), lost days due because of noise-induced health outcomes in the western part of Europe are estimated to be equivalent to 903,000 years for sleep disturbance, 654,000 years for annoyance, 61,000 years for ischaemic heart disease and 45,000 years for cognitive impairment in children. It is estimated that noise could contribute to 16,600 premature deaths per year, about two thirds of the burden of disease is related to coronary heart disease and one third to cerebrovascular disease. The analysis carried out for 30 European capitals shows that the highest number of years of life lost (YLL) per 100,000 inhabitants attributable to noise occurs in the new Member States in Eastern Europe.
Exposure to heat in cities
The temperatures in European city centres can be higher than in surrounding areas by up to 9 degrees Celsius. Generally, northern European cities seem to develop stronger UHIs (Urban heat island), whereas differences between urban and rural temperatures appear to be lower in southern European cities. As a consequence of the UHI, urban areas may experience twice as many heatwave days compared with their rural surroundings. Generally, in many European countries, more vulnerable communities tend to live in dense, urban environments and, therefore, may be exposed to higher temperatures. In locations such as Rennes, France, and Birmingham, United Kingdom, city centres are characterised by high proportions of the elderly, people in poor health and those living alone. They also have the highest intensity of UHIs. In London and Greater Manchester, United Kingdom, poorer communities are more likely to live within UHIs. In addition, analyses of the distribution of facilities for vulnerable groups, such as hospitals, care homes and schools, found that they were predominantly located in areas up to 2 degrees Celsius warmer than the regional average. However, more affluent people are living centrally in some cities, and thus are potentially more exposed to UHIs. Less is known about the influence of UHIs on mortality related to low temperatures. In England and Wales, cold-related mortality was higher for more deprived populations in rural settings, while no such relationship was observed in cities. It is suggested that in the cities, which experience low temperatures during winter, UHIs may bring positive effects for human health by increasing temperatures and consequently creating a warmer environment than in the surrounding areas.


Extreme temperatures
The extreme temperature indicators in this report have been chosen according to their relevance to the impacts of extreme temperatures on human health, especially taking into account the indicators of social vulnerability, and they include the following indicators based on the E-OBS dataset.
- The number of days with a maximum temperature exceeding 30 degrees Celsius and a minimum temperature above 20 degrees Celsius per year, averaged over the period 1987-2016. The combination of hot days and warm nights increases the risk of heat stress; therefore, this indicator is particularly relevant for assessing the proportion of elderly people in the population who are prone to heat-related impacts.
- The number of hot summer days when the temperature exceeds 35 degrees Celsius per year, averaged over the period 1987-2016. This may bear particular relevance to the health of workers in outdoor or high-temperature indoor settings, who tend to have a lower level of education. It has also been estimated that as many as 40% of deaths associated with heat occur on isolated hot days during periods that would not be classified as heatwaves and, consequently, individual hot days may have an impact on the health of sensitive groups, such as the elderly.
- The number of cooling degree days (CDDs) per year, averaged over the period 1990-2015. CDD is a measurement designed to quantify the demand for energy needed to cool a building in order to keep it at a comfortable temperature. In this report, it is defined as the sum of the difference in degrees between 21 degrees Celsius and the mean temperature over the year, for the days when the mean daily temperature is higher than 21 degrees Celsius.
- The number of heating degree days (HDDs) per year, averaged over the period 1990-2015. HDD is a measurement designed to quantify the demand for energy needed to heat a building in order to keep it at a comfortable temperature. In this report, it is defined as the sum of the difference (in degrees Celsius) between 18 degrees Celsius and the mean daily temperature over the year, for the days when mean daily temperature is lower than 15 degrees Celsius. The number of CDDs and HDDs is useful in differentiating between areas based on the need for heating or cooling homes, and therefore HDDs and CDDs are both relevant to issues of energy affordability and energy poverty. Furthermore, ‘non-extreme’ temperatures outside a local comfort temperature range are also linked to increased mortality and other adverse health outcomes. Consequently, identifying areas with the greatest deviation from comfort temperatures can help to approximate the places where human health is at risk.
Unsurprisingly, the indicators relating to high temperatures have the highest values in Southern and South-Eastern Europe. Their spatial distribution varies slightly: areas with maximum temperatures exceeding 35 degrees Celsius for over 10 days are concentrated in the Iberian Peninsula, while areas with the highest number of combined hot days and tropical nights are also found in Italy and parts of Greece. The highest number of HDDs is present in Northern Europe, the Alpine region and, to a lesser extent, in Central and Eastern Europe.
Levels of regional vulnerability
Analysing distribution of high and low temperatures by regional vulnerability levels generally, the NUTS (Nomenclature of territorial units for statistics regions) classified as more vulnerable as a result of low GDP (Gross Domestic Product) or a high proportion of people of low socio-economic status correspond to areas affected by high temperature. This is because many regions in Southern and South-Eastern Europe have high levels of unemployment, lower incomes and lower levels of educational attainment than the European average.
The areas most affected by both long-term unemployment and high temperatures are located in parts of Bulgaria, Croatia, Greece, Italy and Spain. This is in agreement with the EU-SILC (European Union statistics on income and living conditions) data on the ability of people to keep their houses at comfortable temperatures during winter and summer. The areas in the bottom 20% of NUTS regions regarding the percentage of people with higher education experience, on average, 1.7 times as many days with a maximum temperature over 35 degrees Celsius as the regions in the top 20%. This may mean that the areas where lower levels of education and high temperatures overlap experience more pronounced negative impacts of high temperatures when it comes to the health of people working outside or in already hot environments.
According to the EEA report, lower levels of education and substantial average number of hot days overlap spatially in southern Portugal and parts of Bulgaria and, to a lesser extent, in parts of Greece, Hungary, Italy and Romania. The associations between the socio-economic status aspects of vulnerability and extreme temperatures are much less pronounced for cities than for the NUTS regions. This is similar to the findings for air pollution and it could be linked to the way in which cities usually differ from the regions they are located in, especially in relation to income or levels of education, shows the European Environment Agency report.