

4% decline in gold demand in Q2
Global gold demand remained muted in Q2 2018 at 964 tonnes (t), 4% below the same period in 2017, according to the World Gold Council’s latest Gold Demand Trends report. Slower inflows into gold-backed exchange-traded funds (ETFs) created a weak comparison against the highs of last year, contributing to the lowest H1 demand since 2009. Whilst China, the world’s largest gold market, saw a 7% rise in consumer demand as bar and coin demand rose 11% and jewellery demand hit a three-year high.
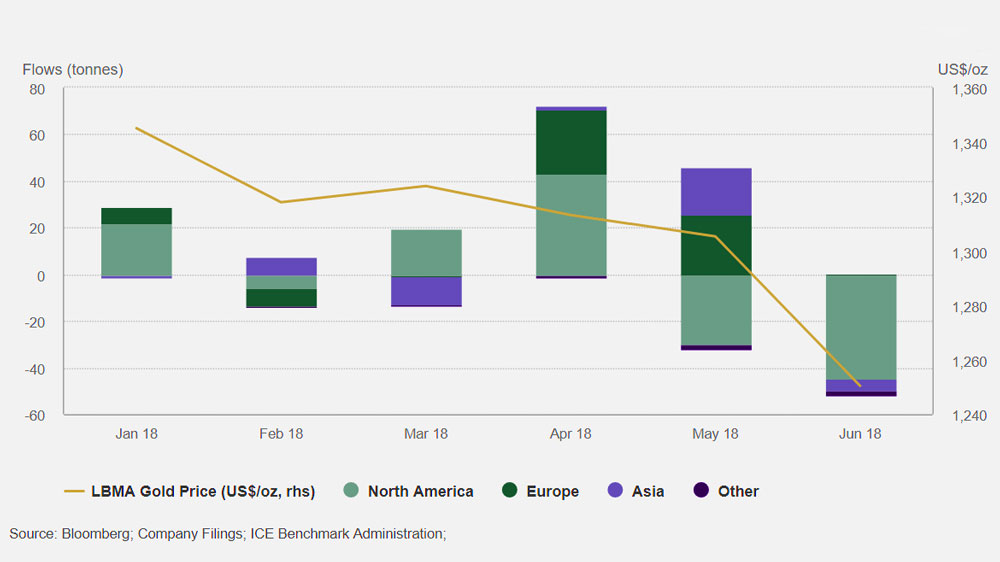
- ETF inflows continued, albeit at a much slower pace compared with the high levels seen in 2016 and 2017. Inflows were down 46% y-oy. However, European-listed funds saw decent inflows due to uncertainty stemming from Italian elections and monetary policy outlook. In contrast, holdings of North American-listed funds fell by 30.6t as investors focused on domestic economic strength.
- Despite the Q2 decline, H1 jewellery demand was scarcely changed at 1,031t. Weaker demand in India and the Middle East in Q2 was only partly offset by growth in China and the US, both up 5% compared with the previous year. Indian demand fell 8% y-o-y, crimped by higher local prices, as well as by seasonal and religious factors.
- Q2 2018 saw the seventh consecutive quarter of year-on-year growth in the technology sector, with demand up 2% to 83t. Gold used in electronics continued to thrive, due to enduring demand for smartphones, games consoles and vehicles. H1 demand reached a three-year high of 165t.
- Global bar and coin investment were virtually unchanged at 248t. Stronger demand in China and Iran – fuelled by increasing geopolitical tensions with the US – were offset by falls in Turkey, India and Europe, where local prices remained elevated.
- Central banks added 89t of gold to global official reserves in Q2 2018, down 7% compared with Q2 2017. Cumulative H1 2018 purchases of 193t were the highest since 2015. Alongside the familiar cast list of Russia, Turkey and Kazakhstan, the Reserve Bank of India returned to the market, albeit with only a very small purchase (+2.5t).
“It’s interesting how investors around the world have reacted to some of the risks stalking financial markets. Weaker economic prospects and tumbling currencies off the back of heightened tensions with the US boosted Chinese and Iranian gold demand, while US investors shrugged off any geopolitical concerns. Demand from tech companies continued to grow, with H1 demand reaching a three-year high, while economic growth boosted jewellery demand in the US with Q2 demand hitting a ten-year high,” Alistair Hewitt, Head of Market Intelligence at the World Gold Council, commented.
The total supply of gold increased by 3% in Q2 2018 to 1,120t, supported by increased mine production and recycling growth. Mine production in Q2 saw a rise of 3% to 836t, the highest Q2 on record, as projects in Russia, Indonesia and Canada continued to ramp-up. Gold recycling also grew, as currency weakness in India, Turkey and Iran boosted local gold prices and encouraged consumers to lock in profits from their holdings.
Key findings
The key findings included in the Gold Demand Trends Q2 2018 report are as follows:
- Overall demand was 964t, a decrease of 4% compared with 1,008t in Q2 2017;
- Total consumer demand fell by 1% to 758t, from 767t in the same period last year;
- Total investment demand was down 9% to 281t compared with 310t in Q2 2017;
- Global jewellery demand fell 2% to 510t, from 519t in the same period in 2017;
- Central bank demand decreased by 7% to 89t compared with 96t in Q2 2017;
- Demand in the technology sector increased 2% to 83t compared with 81t in Q2 2017;
- Total supply was up 3% to 1,120t, from 1,086t in the same period last year;
- Recycling was up 4% to 295t, compared with 283t in Q2 2017.
Modest inflows into gold-backed ETFs were dominated by Europe
Global gold-backed ETFs saw another quarter of muted growth: inflows of 33.8t were considerably lower than the 62.5t increase during Q2 2017. H1 inflows of 63t were the lowest since the first half of 2015, despite mounting global trade tensions and relatively volatile stock markets. By the end of H1, global holdings stood at 2,434.3t. ETFs have seen steady but modest investment over the last four quarters, with holdings increasing by an average of 27.2t per quarter.
In something of a reversal of the Q1 trend, inflows in Q2 were directed towards European-listed funds while North American funds saw net outflows. Early in the year geopolitical concern (primarily surrounding tensions with North Korea) together with a weakening of the US dollar, made US investors skittish, driving investment into gold-backed ETFs. Around mid-April, these issues began to subside and the US economy showed continued improvement, taking the momentum out of US inflows. At the same time, Europe saw political instability escalate, and this – in conjunction with a marked depreciation of the euro – encouraged a flight to safety in European-listed gold-backed ETFs.
European funds absorbed 53.2t of inflows and AUM in the region reached 1,052.7t by the end of the quarter. Inflows were up by 53% y-o-y. Y-t-d, European products have led the way, accounting for 83% of total global inflows during H1. Inflows were indicative of regional geo-political turbulence. Indecisive Italian elections led to protracted negotiations, finally culminating in the creation of a vocal populist coalition in June. Uncertainty over the direction of central bank policy was a further incentive for investors to seek refuge in gold-backed ETFs. But momentum was less than stellar as investors in the region lacked a clear signal from the euro-denominated price.


Bar and coin
The global bar and coin market remained subdued in Q2 2018. Demand was flat y-o-y at 247.6t and, at the halfway stage of the year, is bang in line with the three-year average: 509.1t in H1 2018 compared to the H1 average of 508.6t from 2015 to 2017.
Price dips often tease out an investor response, but, for many markets, the 5.5% fall in the US dollar gold price over the quarter failed to translate into buying opportunities because of local currency weakness. Investor concerns over currency depreciation were, however, a driver of demand in some markets, most notably China and Iran.
China, the world’s largest bar and coin market, saw demand rise 11% to 69.5t as gold benefited from a flight to safety amidst increasingly tense trade-war rhetoric. The yuan weakened drastically against the US dollar, falling 5% over the quarter. And the stock market slumped: the Shanghai Stock Composite index dropped 14% in the first six months of the year. The y-o-y rise was from a relatively soft quarter in Q2 2017. Bar and coin demand have held in a relatively steady range over the last five quarters, hovering between 60 and 80 tonnes.
Turkish demand suffered at the hands of a deteriorating economic outlook and a weak currency. Demand halved y-o-y and dropped 11% q-o-q as the Turkish lira gold price rose to a record high in late May, almost touching TRY202/g. Turkey’s briskly expanding economy and the threat of a weakening lira has created relatively buoyant bar and coin demand in recent quarters. Having bought into a rising gold price over the past 12 months, the recent leap higher off the back of a plummeting currency proved too much for many investors. Fresh buying activity fell in Q2 and, as explained in the supply section, recycling rose as investors locked in profits from gold’s price appreciation. The snap general election in June and the start of Ramadan dampened investor interest towards the end of the quarter.
European bar and coin demand slipped 15% y-o-y to 33.5t. Germany, which accounts for the lion’s share of the European market, saw demand fall 9%. This combined with a relatively soft Q1 to produce the weakest H1 since 2008. Bullion dealers in the region noted that retail investors were less concerned than ETF investors about the impact of the Italian elections and European Central Bank interest rate rises, and that a gold price above EUR 35k/kg for much of Q2 (due to euro weakness) was perceived as relatively expensive. Some dealers reported an upturn in activity as the euro-denominated price fell sharply towards the end of the quarter, but it was too little too late for Europe’s Q2 bar and coin demand estimate.
Central Banks and other institutions
Central banks added 89.4t (on a net basis) to global gold reserves in Q2, down 7% y-o-y. While the pace of purchasing lags that of recent years, volumes remain healthy. Looking at H1, net purchases totalled 193.3t, 8% higher than the same period last year.
Russia, Kazakhstan and Turkey led H1 net purchases
Purchases in Q2 and H1 were dominated by the familiar trio of Russia, Kazakhstan and Turkey. Russia again led the way, accumulating a net 53.2t in Q2, 49% up on Q2 2017. This brought H1 net purchases to 105.3t (5% y-o-y), and gold reserves to 1,944t at the end of June (17% of total reserves). Russia’s voracious appetite for gold is strategic – amidst geopolitical tensions it looks to diversify away from the US dollar.
Kazakhstan continued its lengthy buying run. The central bank continued its monthly buying, with the result that gold reserves grew by 11.6t during Q2 to 20.7t (3% y-o-y). The country’s gold reserves have now grown for 68 consecutive months. At the end of the quarter there were calls in Kazakhstan’s lower house of Parliament for the bank to further increase gold reserves in the face of geopolitical and economic risks, and uncertainty arising from the global shift towards a multicurrency system.
Turkey’s central bank further increased gold reserves, albeit at a slightly slower pace. H1 net purchases totalled 38.1t (+82% y‑o‑y) after net purchases of 8.3t (-60% y‑o‑y) in Q2. Despite the lower level of purchases in recent months, Turkey retains its strategic commitment to gold. Gold reserves totalled 240.2t at the end of June, 107% higher than when net purchases began in May 2017.
During H1, the State Oil Fund of the Republic of Azerbaijan (SOFAZ) added around 2.8t of gold to its portfolio. This is the sovereign wealth fund’s first purchase of gold since Q4 2013, with gold reserves now standing at 33t.
Once again, net reductions remained trivial in relation to increases. Among the handful of central banks that reduced their gold reserves in H1, Venezuela was the most significant. Gold reserves have declined 11.9t in H1 2018 (accounted for solely in January) in response to the perilous economic situation facing the country. However, it was later reported that Venezuela sought to recover some gold lost through the lapsed swap at the end of 2017. Gold reserves in Australia (4.1t), Qatar (Xt), Germany (3.8t), Sri Lanka (2.4t) and the Ukraine (1.2t) have also declined in H1.