
Improving the efficiency of oil recovery
Evaluation of water injection in mature reservoirs
Taking into account that the efficiency of these processes depends on both the quality of the water injected and the compatibility with fluids and rock from formation, the key focus of this project is to make an evaluation of the way in which the water used for these processes responds to the two requirements. Therefore, the chemical water analysis and the compatibility test between the injected water, rock and reservoir fluids can be done.
The project results can be used both for the design/upgrade of the water injection stations and to enhance the efficiency of recovered oil as a result of water injection. This project presents specific laboratory and field data required for waterflood process like:
- Fluid properties;
- Rock properties;
- Flow properties;
- Residual oil saturation;
- Water quality.
A detailed protocol has been developed to guide one through the proper steps and analysis which must be conducted to ensure acceptable injection water quality is present to maintain a long term, economic injection process. There were presented two types of dynamic tests that are necessary to be performed when you want to design or optimize a water injection process.
Objectives of this paper are to establish the types of tests and analyses necessary to be performed in applying of water injection processes.
Water injection processes are the most common in Romania and in the world. At the moment, an important percentage of the total oil production comes from mature operated fields, through water injection. A water injection process is realized in order to maintain reservoir pressure or to displace oil. Because most of the fields, where these processes are applied, are mature fields some of them having high degree of depletion, the water is injected as an oil displacement process.
Waterflood is a widely used commercial recovery process for the following reasons:
- Water is generally available and relatively easy to inject;
- Water is an efficient agent for displacing light/medium gravity oil;
- Flooding involves low capital investment and operating costs and has favourable economics;
- Water spreads easily through an oil-formation.
The level of effectiveness of a waterflood depends on the mobility ratio between the oil and water, and the geology of the oil reservoir. Waterflooding is effective because almost all reservoir rocks are either water-wet or mixed-wet.
Waterflooding is a process that typically takes several decades to complete. Hence, continuous, routine field production and pressure data must be taken for monitoring and analysing waterflood performance. There are opportunities to modify the original waterflood design and operating guidelines on the basis of analysis of the actual field production data.
Occasionally, more expensive, special-data acquisition programs (i.e., 3D- or 4D-seismic data) are run to assist the evaluation process. A variety of engineering tools have been developed to analyse waterflood performance, ranging from simple plots of field production data to full-field numerical-reservoir-simulation models.
Waterflooding successful operations require:
- Developing an economically viable plan;
- Implementing the plan;
- Monitoring and evaluating performance;
- Revising plans and strategies.


Laboratory static tests for determining the water quality used for waterflooding process
The objective of any water-injection operation is to inject water into the reservoir rock without plugging or permeability reduction from particulates, dispersed oil, scale formation, bacterial growth, or clay swelling. Ideally, injection water should enter the reservoir free of suspended solids or oil. It should also be compatible with the reservoir rock and fluids and would be sterile and non-scaling.
Laboratory tests are designed to determine, understand and quantify the governing processes, their parameters, and dependency on the in situ and various operational conditions, and their effect on formation damage. Laboratory tests help determine the relative contributions of various mechanisms to formation damage. For convenience, the frequently encountered formation damage mechanisms can be classified into two groups:
- Fluid-fluid interactions include: emulsion blocking, inorganic deposition, organic deposition.
- Fluid-rock interactions include: mobilization, migration and deposition of in-situ fine particles; invasion, migration and deposition of externally introduced fine particles; alteration of particle and porous media properties by surface processes such as absorption, adsorption, wettability change, swelling; damage by other processes, such as counter-current imbibition, grinding and mashing of solids, and surface glazing that might occur during drilling of wells.
The static analyses that are made in the laboratory to characterize reservoir fluids are:
- Reservoir fluids: water/oil:
- pH, density, electrical conductivity, TDS;
- Composition (anions, cations), alkalinity, organic acids;
- Suspended solids (quantity and particle size distribution);
- Dissolved gases (CO2, H2S);
- Bacteria;
- Oil: density, viscosity curve, SARA analysis, TAN.
- Water options identification (sources and requirements):
- Analysis for possible water sources:
- pH, density, electrical conductivity, TDS;
- Composition (anions, cations), alkalinity, organic acids;
- Suspended solids (quantity and particle size distribution);
- Dissolved gases (O2, CO2, H2S);
- TPH/Free oil and grease (FOG);
- Filterability test;
- Bacteria.
- Compatibility tests between 2 or more water sources;
- Compatibility tests between injection and reservoir waters;
- Measurement of interfacial tension.
- Analysis for possible water sources:
- Water quality requirements – must be correlated with reservoir characteristics:
- Establishing of oil/water separation characteristics;
- Settling time test for suspended solids;
- Suspended solids (content and distribution) for different stages of treatment.
- Compatibility tests between treatment chemicals and water
- Selection of water treatment options and available technologies
In order to obtain accurate results, the water must be carefully sampled and characterized to assess the likely problem areas.
Sampling requirements
Water injection samples shall be taken under normal operating condition of the plant
- The sampling shall be performed according to the current OMV Petrom standards and norms;
- Special connection and recipients shall be used for sampling of each probe;
- The description of each sample is necessary to be done very accurate for easy identification of the location and the condition of the system during sampling.
The minimum given information shall be:
- A detailed description of the point of sampling, date, time stamp and person;
- Specify operating condition (pressure, temperature, etc.);
- Pictures of the sampling location will be required.
In case where it is necessary to be performed an analysis of the water reservoir, in terms of similarities/differences depending on certain productive horizons or in terms of their compatibility with water injection, we can use diagrams drawn using chemical composition of water studied. In the literature, there is material in this sense, describing such diagrams, from plotting to interpretation. Examples of charts used: Stiff diagram, Schoeller, Piper, Durov etc. Schoeller diagram, the concentrations of ions in water (SO4, HCO3, Cl, Mg, Ca, Na/K).
Simulation with multiscale software
Scaling deposition can occur in both injection wells, and production wells. To dissolve these scales, depending on the type of mineral deposited, different stimulation solutions should be applied. It is therefore important to know, firstly, the type of crust (see table Types of scaling found in oil field).
| Types of scaling found in oil field | |
| Mineral | Variables that influence the solubility |
| Calcium carbonate * CaCO3 | CO2 partial pressure, pH, temperature & pressure, TDS |
| Calcium sulfates: Gypsum* CaSO4 X 2H2O Hemi-hydrate CaSO4 X 1/2 H2O Anhydrite CaSO4 | temperature, TDS, pressure |
| Barium sulfate BaSO4 (barite) | temperature, TDS, pressure |
| Strontium sulfate SrSO4 (celestite) | temperature, TDS, pressure |
| Iron compounds: ferrous carbonate FeCO3 Iron sulphide FeS Ferrous hydroxide/ferric Fe(OH)2/Fe(OH)3 ferric oxide Fe2O3 | dissolved gases, corrosion, temperature, pressure, pH |
| Obs. – * Calcite and gypsum most common forms of minerals | |
Multiscale software makes predictions on scaling depositions through mathematical modelling. These estimates are more or less close to reality, depending on the input for modelling. Depending on the input, there are three kinds of software multiscale mathematical modelling, as follows:
- Analysis of water (not consider oil analysis);
- Water & gas analysis;
- Analysis of water & gas & oil (the best prediction for crusts formed, including where these scaling can occur and how severe is this issue).
In general, the tendency for scale deposition is analysed for production and injection wells with multiscale software, based on the following data:
- Chemical composition of water content in organic acids;
- CO2 content in gases produced by the well;
- Reservoir conditions (pressure, temperature);
- Flow of water produced for the production wells & water flow injected to injection wells.
Setting water quality, limits and treatments
Once the water and the rock have been characterized, the difficult task of deciding how much water processing is required to create non-plugging water begins. In oilfield water floods, considerable attention is given to the quality of the water injected into the formation to ensure that optimal injectivity is maintained and to prevent the occurrence of formation damage. Formation damage depends on the properties of the fluids and the geological porous media, and their respective interactions.
In addition, the injection system must be protected against corrosion to preserve its physical integrity and to prevent the generation of insoluble corrosion products. Any insoluble material in water, either solid or liquid, can contribute to plugging. This includes formation solids (sand, silt, or clay), corrosion products, water-formed scales, bacterial growths and algae, oil (both crude and lubricating), and undissolved treating chemicals.
The contaminants primarily responsible for plugging fall into three categories:
1.Present at the source. Some of the primary contaminants commonly present at the source include: in produced water – oil, corrosion products from the production system, bacteria; in water supply wells – formation solids, corrosion products, bacteria; and in surface waters-dissolved oxygen, bacteria, suspended inorganic solids, marine organisms.
2.Generated within the injection system. Contaminants generated within the system may include corrosion products, bacterial masses, biogenic hydrogen sulphide, and scale.
3.Added to the injection system. Sometimes, intentionally added materials ultimately contribute to plugging. For example, contaminants such as dissolved oxygen, bacteria, suspended solids, and usually oil are the inevitable results of pumping trucked water or pit water into an injection system. Improperly selected corrosion inhibitors that are not sufficiently soluble in the injection water can contribute to plugging.
The difficulty of preserving water quality is essentially a direct function of the length and complexity of the injection system. The result is that the quality of the water reaching remote injection wells in long systems is often considerably worse than it was at the source.
Water quality requirements
When the quality of the injection water is inadequate, reservoir plugging results. The consequence of plugging is reduced sweep efficiency, which results in decreased recovery and, ultimately, loss of revenue. In addition, operational costs are increased because of workovers and system repairs required to restore injectivity.
The quality required for a given reservoir will be primarily a function of reservoir permeability, assuming true matrix injection into the reservoir pore space. Tight, low-permeability zones generally require better-quality water than higher-permeability zones.
During water flooding, suspended solids introduced into the formation via the injected water are a major cause of reduction in permeability of the formation rock. Thus, formation damage can be caused by suspended silts, clays, scale, oil, or bacteria, which may be present in the injection water. Most methods attempt to correlate the suspended-solids concentration, particle-size distribution, or water-quality measurements with the formation permeability or pore-size distribution.
It is important that, for each chemical added into the injection water, to perform compatibility tests between treatment chemicals and water.
When produced water is injected, the water contains both solids and oil. Attempts to estimate acceptable levels of suspended solids and oil with theoretical models have not been successful to date. Empirical correlations currently offer the best hope.
Dynamic tests and results interpretation
In order to achieve the pursued objectives, a series of standard methods for fluid, core and device preparation mast be duet. The dynamic tests were run on FRT equipment (see Figure 1).
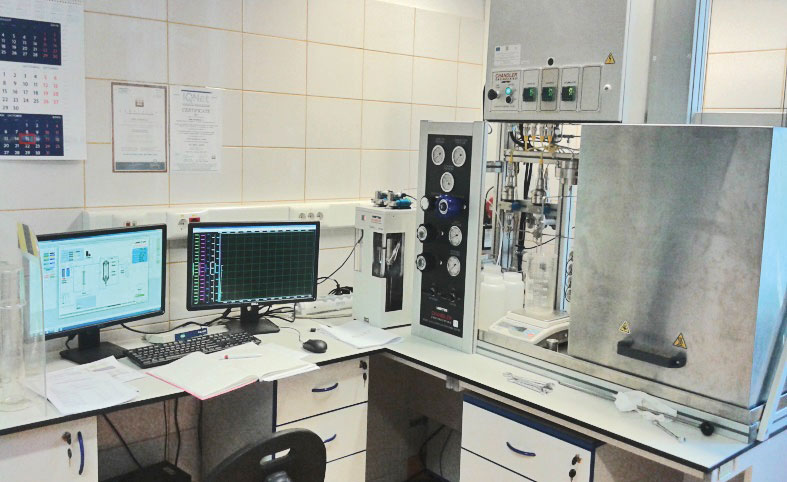
The following procedure has been designed to provide a methodology for assessing formation damage in a variety of testing situations.
In these tests it is monitored the behaviour of the flow parameters (permeability and differential pressure) for large volumes of reservoir and injection water through the core sample. The water must be prepared, by filtration and chemical addition established after the static tests.
Dynamic tests for determining compatibility between injection water, reservoir water and rock
In general, laboratory tests have the role of simulating processes done in the field, under laboratory conditions accordingly with established methodologies for each and every test. This work aimed to determine how the permeability of the analysed rock is changed, in the water injected process.
Preparing the core samples for dynamic tests, consisted of their saturation with reservoir water filtered through 0.2 µm, in two stages: initial under vacuum after which the core samples were maintained at a pressure of about 50 bar for 3-4 days, for a 100% saturation with brine.
For this kind of tests, we can have four water sources that can be used like injection water:
- Reservoir water;
- Mix of reservoirs water;
- Fresh water;
- Mix between reservoir and fresh water.
In dynamic tests it is monitored the behaviour of the flow parameters (permeability and differential pressure) for large volumes of injection water fresh water and mixture between them.
The experimental data acquired by the equipment software are Kw (core permeability to injected water) and DP (differential pressure).
Results interpretation
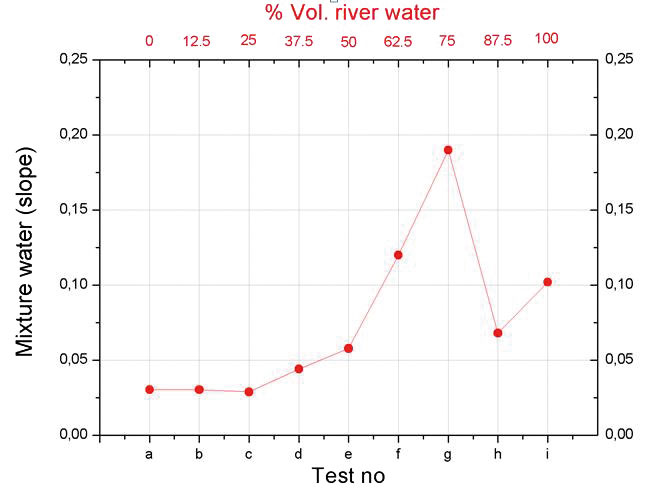
Calculation of the variation of DP & K, is performed using only value recorded during last 10 PV of injection water, (in addition, these values were taken into account in interpreting rock sensibility to water). In order to make a more accurate analysis of flow parameters variation during increasing the percentage of river water, there were calculated, for each test, the slopes of differential pressure regression line, with a Fit Linear function. The graphical representation of the slopes is shown in Figure 2.
An empirical classification of the rock in terms of its sensitivity to water is made by the ratio of the sandstone permeability to water and Klinkenberg permeability. According to Muddy, Stevens and Bow Island thus, the rocks can be divided into the following categories:
- Rocks with low sensitivity to water (Kwater/KKlinkenberg = 0.7 to 1.0);
- Rocks with moderate sensitivity to water (Kwater/KKlinkenberg = 0.3 – 0.7);
- Rocks with high sensitivity to water (Kwater/KKlinkenberg <0.3).
According to the above, in our case it was agreed to investigate the behaviour of sandstones for the injection of the tested water mixtures (river water + injection water), using the type (a) graph and the results are presented in Figure 3.

Conclusions after dynamic tests:
- The percentages of change for differential pressure for water injected, were calculated as follows: Dpinitially = Dpmixed water @10 VP & Dpfinal = Dpmixed water @ 80 VP. After 24 hours it was noticed that the maximum increase of Dp is for the test Tg (75% vol. river water), when Dpfinal = Dpinitial x 2.7 times (this maximum increase for Test g is confirmed by the slope of differential pressure graph for dynamic tests);
- Rocks sensitivity to injected water changes with river water content in the injected water mixture:
- for mixture with <50% vol. river water, cores are found in low sensitivity to moderate sensitivity area;
- for mixture with ≥ 50% vol. river water, cores are found in moderate sensitivity to the high sensitivity area.
Water and core analysis after performing the dynamic tests
In order to investigate phenomena that occur by injecting mixtures of water the following analysis were performed:
- Analysis of water effluents from the dynamic tests in order to determine the chemical composition of water before and after water injection through the core;
- Analysis of core samples after performing the dynamic tests in order to determine if there are changes of physical properties (porosity/permeability).
Dynamic tests for determining particle fine migration – Critical Flow Velocity
For performing this type of tests, it is necessary to prepare the water samples. The sample it’s prepared in the laboratory following the next steps:
- Air bubbling for 24 h, in order to form deposition of the iron oxides, and vacuum filtration of the water, through 3-5 μm filter paper, and filtering membranes from acetate cellulose, of 0.45 μm and 0.2 μm, respectively. Iron compounds formed were removed through filtration;
- Inhibiting the water with scale inhibitors biocides; all the water samples were degassed before use;
- determination of water density & viscosity, for the temperature used during dynamic tests with DMA Anton Paar density meter respectively Ubbelohde viscometer.
Water samples used in the dynamic tests are prepared in this way in order to avoid decreasing of permeability, blockages, due to: iron-based deposition, impurities introduced with the water (solids, oil) and the presence of microorganisms.
Test consisted in core flooding with 20 pore volumes of injection water, for each flow rate, at different rates (0.05, 0.10, 0.40, 0.6, 1.0, 2.0…….16 ml/min) with returning back to the initial flow of 0.2 ml/min. after each increasing of the flow rate.
The maximum flow rate depends of the obtained results (if the critical flow was reached). Core permeability and differential pressure across the core were monitored, during injection of 20 pore volumes of water at different flow rates.
In order to perform the dynamic test for determining the maximum flow rate without affecting the permeability by fine migration particle will account for three stages, as follows:
1.First stage of the tests is identical for all this type of tests:
– saturation of core sample with brine; initially under vacuum and then under pressure, core samples being maintained at a pressure of about 50 bar for 3-4 days, in order to obtain 100% saturation with brine;
– introducing of core sample in the Hassler cell of FRT equipment and achieving the reservoir conditions.
2.Second stage can be different as follows:
Case 1: Core is flooded for each flow rate with 20 pore volumes of injection, at different flow rates.
Case 2: Core is flooded, for each flow rate, with 20 pore volumes of injection water, at different flow rates. In this case we have a core sample that we know she hasn’t in his geology description much minerals that can disperse and migrate.
Case 3: Core is flooded with 20 VP of injection water blended with river water (or in ratio of 1:1, at different flow).
3.Third stage also can be different as follows:
Case 1: Core was flooded with 10 VP of fine stabilizer solutions at a flow rate of 0.4 ml/min. After this step, the brine blended with river water from in ratio of 1:1 was injected through the core at different flow rates.
Case 2: Core is treated with 10 VP of fine stabilizer solutions at a lower flow rate than the critical flow rate obtained. After this step, the injection water is injected through the core at different flow rates.
After the third stage one will repeat the test with one of the cases from the second stage.
Results and interpretation of dynamic tests
In order to understand how it is interpreting these results, an example of a test performed in the laboratory for a hypothetical reservoir is presented.
The permeability values obtained for these flow rates were ranging between 5.25 – 5.6 mD, except the first two rates (0.2 and 0.4 ml/min) for which core permeability to water are around 6 mD.
The values calculated for DP/Q and K/K1 ratios, based on the experimental data obtained during test, are graphically represented in Figures 4 and 5. These figures illustrate the same results obtained for tests C3 and C4. Note that K1 is the value for permeability obtained for the first flow rate, 0.2 ml/min.
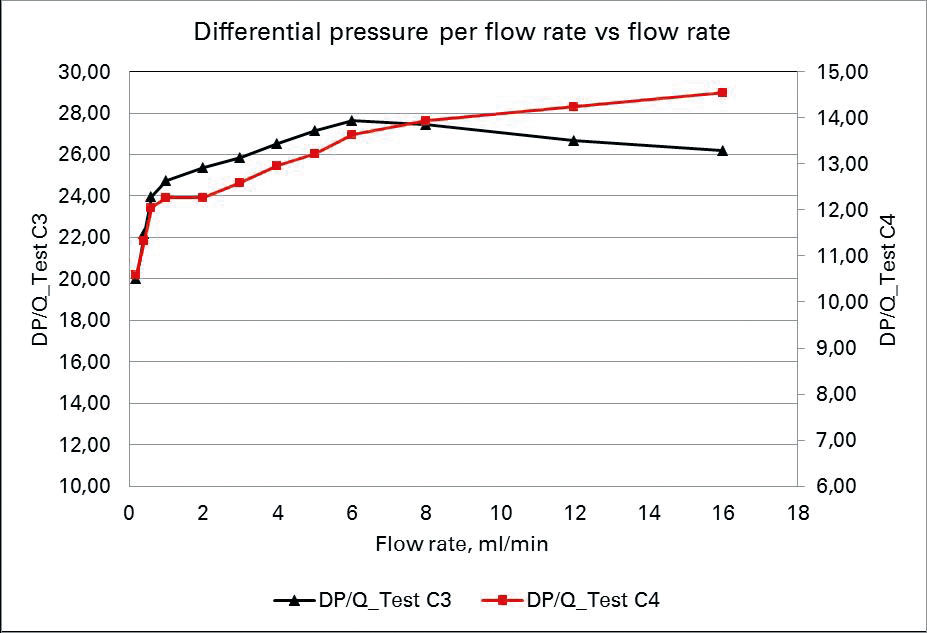
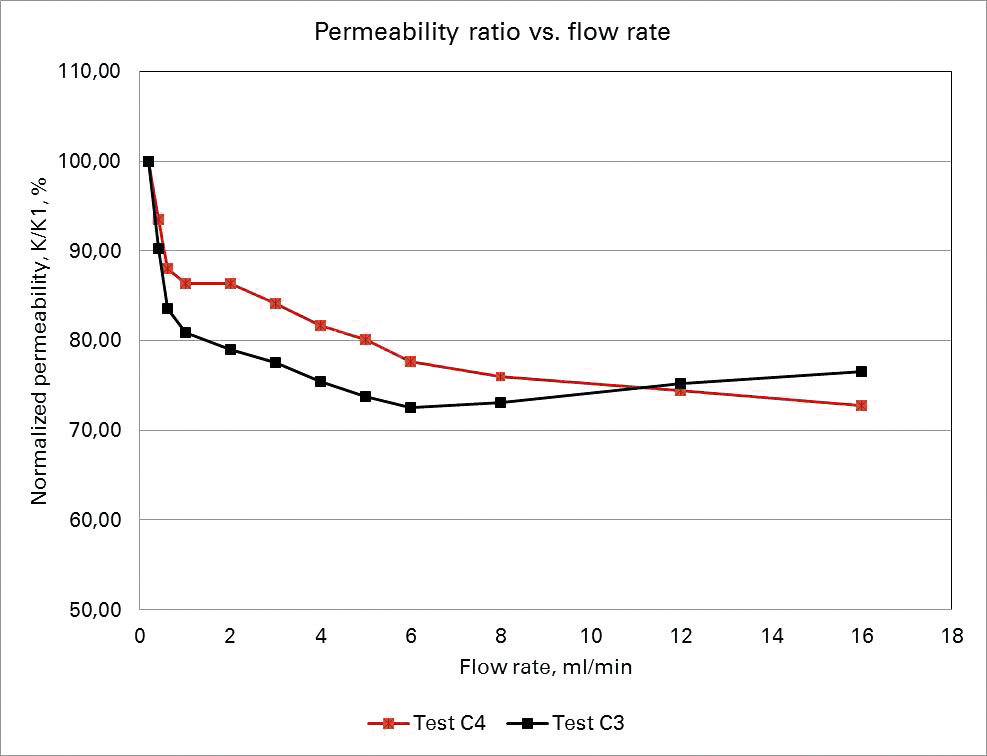
The critical flow velocity was considered to be the one based on the minimum flow rate where it was noticed the first significant increase of the slope calculated as described above.
Converting the critical flow velocity to wellbore injection rate
Based on critical flow velocity values obtained on core flooding tests, performed with and without fines stabilizer, the equivalent of daily volume of water injected for each injection well is calculated. For this purpose, the interstitial flow velocities, expressed in terms of the parameters of the core plug and perforated wellbore interval, are equated as:

The reports also have conclusions of the tests and our recommendation regarding on the optimal flow rate for water injection, so that the damage is minimal or not at all for injection process.
All the analysis and tests presented in this project aims to obtain an efficient exploitation of petroleum reservoir after applying a waterflooding process. If we succeed to pay the necessary attention on each analyse and test, we will be able to have enough information on issues that may arise in the process of water injection.
Flow chart for projecting a waterflooding process
Following these tests and analyses, we have developed a work flow chart to assist in designing future waterflooding processes. This diagram aims at summarizing the main steps that should be done for an accuracy analysis of the water which are to be used for injection.
Also, the project includes a table with description of various test protocols for water quality evaluation (see Table Description of various test protocols for water quality evaluation).
| Description of various test protocols for water quality evaluation | |
| Analyzes / tests | Methods/ Used technique |
| Basic Reservoir Quality | Permeability, porosity, mineralogy via conventional core analysis, pressure transient analysis, drill cuttings analysis and petrographic analysis (thin section, scanning electron microscopy, x-ray diffraction, image analysis) |
| Water Composition | Analysis via standard analytical ICPT techniques |
| Total Suspended Solids | Via pressure filtration |
| Size Distribution of Suspended Solids | Via laser diffraction analysis |
| Composition of Suspended Solids | Via x-ray diffraction or elemental analysis (XRF) |
| Oil and Grease Content | Via ASTM extraction |
| Scale Analysis | Simulation – Multiscale Software |
| Sulfate Reduction Bacteria/Other Bacteria | HYDA analysis, full culture analysis |
| Dissolved Oxygen Content | Via dissolved O2 meter |
| Dissolved Gas Content | Via high temperature solubility testing to liberate dissolved gas |
| Fines Migration Tests | SCAL (Special Core Analysis) conducted on preserved/restored state core to determine critical injection interstitial velocity at which damaging fines migration may occur |
| Phase Trapping Tests | SCAL test conducted to determine the effect of the establishment of a trapped critical gas or oil saturation on water phase injectivity in reservoir matrix typical of the expected injection interval |
| Critical Filtration Tests | SCAL test conducted to determine the maximum size of permissible filtration allowed to retain particles large enough to cause plugging and permeability reductions in the matrix |
| Critical Salinity Tests | SCAL test conducted to determine the minimum ionic and cationic composition and pH required to reduce or eliminate permeability reductions due to injected fluid – clay interactions – includes he simple salinity shock test (abrupt transition from formation to inject water). If results of this test are unfavorable, more sophisticated gradual staged salinity reduction tests and other tests to investigate the effect of the presence of various cationic stabilizers on system permeability |
Conclusions
A detailed protocol has been developed to guide one through the proper steps and analyses, which must be conducted to ensure that acceptable injection water quality is present to maintain long term, economic injection.
Various issues, such as ionic composition of the water, chemical incompatibilities such as scale and precipitates, emulsions, suspended solids content, entrained gas, oil and grease carryover, corrosion and bacterial introduction and propagation have been all described as potential injection water quality issues.
Methods that can be used to evaluate the water quality have been described.
There were included some examples describing the way water used for waterflooding process should be treated.
The importance of water quality in maintaining long-term water injectivity in injection wells was highlighted.
Two types of dynamic tests, which should be performed for design or optimize a water injection process, were presented.
A flow chart with the most important steps that should be done before start a waterflooding process in the field was developed and included in the project documentation.
The project also provides the minimum requirements for laboratory analyses and tests that must be performed for proper functionality of the process.