
CEER Benchmarking Report 6.1 on the Continuity of Electricity and Gas Supply
The newly-released document (26 July 2018) provides an update of key data related to continuity of electricity and gas supply found in the more extensive 6th CEER Benchmarking Report published in 2016. CEER aims to provide such updates in between the more detailed reports, in order to provide accurate and up-to-date data on a more regular basis.
Since 2001, the Council of European Energy Regulators (CEER) has repeatedly undertaken a survey and analysis of the quality of electricity supply in its member and observer countries, the results of which are presented in its Benchmarking Reports, the latest of which was the 6th CEER Benchmarking Report (6th BR), published in 2016. While the 6th BR addressed three areas of the Quality of Supply of electricity networks (Continuity of Supply, Voltage Quality and Commercial Quality) and three areas of the Quality of Supply of gas networks (Technical Operational Quality, Natural Gas Quality, and Commercial Quality), this Benchmarking Report 6.1 (BR 6.1) only updates key data in Continuity of Supply of electricity and Technical Operational Quality of gas. All other areas of the Quality of Supply will again be addressed in detail in the 7th CEER Benchmarking Report.
For this update, the CEER Energy Quality of Supply Work Stream mainly focused on recent Continuity of Supply data. Compared to the 6th CEER Benchmarking Report, the BR 6.1 includes several additional figures, such as aggregated box-plot summary graphs. These additional figures illustrate the range of values over the last seven years (provided that the data for at least four of those years are available) in addition to the mean and the latest available value (in this case from 2016). Other figures are similar to those presented in the 6th CEER Benchmarking Report while comprehensive additional information can be found in tables included as annex. In addition to the update of the Continuity of Supply indicators, the most recent data on circuit length and share of underground cables is presented for each responding country.
Since the 6th CEER Benchmarking Report included chapters dedicated to gas for the first time, countries were asked to submit data for the same indicators as in 6th BR, but this time for a longer time period (2010 to 2016). These indicators are:
- System Average Interruption Duration Index (SAIDI);
- System Average Interruption Frequency Index (SAIFI) and
- Customer Average Interruption Duration Index (CAIDI).
The values of unplanned electricity SAIDI and SAIFI seem to be stable or improving over time.
In 2016, unplanned SAIDI including exceptional events had a range between 9 and 371 minutes per customer while unplanned SAIDI without exceptional events was between 9 and 290 minutes per customer. The former indicator includes all interruptions regardless of their cause and is possibly more reliable for benchmarking because of significant differences in definitions of exceptional events across Europe. The 2016 values of unplanned SAIFI including exceptional events were between 0,08 and 4,35 interruptions per customer while unplanned SAIFI excluding exceptional events ranged from 0,05 and 3,83 interruptions per customer.
As in the 6th BR, the comparison of continuity indicators is complicated by the fact that voltage levels are taken into account in different ways across reporting countries. The goal was to include interruptions on all voltage levels, but this proved difficult due to differences in collecting and reporting the data across Europe.
Even though the gas indicators are borrowed from the electricity sector, they should not be interpreted the same way. Due to the possibility of storage in gas grids and very high technical requirements of these grids, continuity of supply is not the main factor influencing decisions of the network operators. Nevertheless, the typically used interruption indicators are good tools for international benchmarking of continuity of supply.
Continuity of Supply indicators for gas are monitored in significantly less European countries than for electricity. Moreover, SAIDI values are generally much lower in gas than in electricity.
This is due to underground gas pipelines which are not exposed to forces of nature in the same way as overhead power cables. In 2016, unplanned SAIDI ranged from 0,008 to 6,043 minutes per customer (with the country with the highest value including major incidents in their interruption indicator). In all other countries, unplanned SAIDI was significantly below 2.
Planned SAIDI values in 2016 were between 0,026 and 23,389 minutes per customer. Similarly, values of planned SAIFI (between 0,0023 – 0,196) were greater than the values of unplanned SAIFI (0,0021 – 0,02 interruptions per customer).
Finally, in addition to the update of Continuity of Supply indicators in gas, the latest available data for gas transmission and distribution pipeline length is included for each responding country.


This Benchmarking Report 6.1 (BR 6.1) aims to provide a partial update of the indicators related to Continuity of Supply (CoS) for Electricity and Gas included in the 6th CEER Benchmarking Report (6th BR), published in 2016. Where the full Benchmarking Report addresses three areas of the Quality of Supply of electricity networks (Continuity of Supply, Voltage Quality and Commercial Quality) and three areas on the Quality of Supply of gas networks (Technical Operational Quality, Natural Gas Quality, and Commercial Quality), this BR 6.1 does not include Voltage Quality and Commercial Quality and Natural Gas Quality. All these areas of the Quality of Supply will be addressed in detail in the 7th CEER Benchmarking Report, which is tentatively planned for publication in 2020.
Therefore, the CEER Energy Quality of Supply Work Stream (EQS WS) focuses on recent CoS data only for this update. This report does not include a thorough analysis of the data submitted by the NRAs, it draws no conclusions and gives no recommendations. This report only serves to present the most recent data on CoS and technical characteristics in electricity and technical operational quality and technical characteristics in gas networks.
This report contains data from all CEER Members except Iceland and Cyprus, as well as from CEER Observer Switzerland. The Slovak Republic, which is neither a Member nor an Observer of CEER, also responded to the questionnaire. Overall, 29 countries responded to the CEER questionnaire. Participation in this exercise has significantly increased since CEER’s 1st Benchmarking Report in 2001.
Main results – electricity
As in the 6th BR, there are cases where values of indicators differ not only because of a different duration or number of interruptions, but because of that fact that different voltage levels might be included depending on the country. The goal was to include interruptions on all voltage levels, but this proved difficult due to differences in collecting and reporting the data across Europe.
A few examples of the distinctiveness of indicators in surveyed countries are:
In the Czech Republic, all values correspond only to TSO and/or 3 largest DSOs which represent the vast majority of the territory of the country.
In Denmark, the definition of LV, MV, HV and EHV differ between the SAIDI/SAIFI values and the reported length of circuits at different voltage intervals. When considering SAIDI/SAIFI values, the following definitions apply: LV = 0,4 kV, MV = 1–24 kV, HV = 25–99 kV, EHV = none. When considering circuit length: LV = 0,4 kV, MV = 0,4–10 kV, HV = 10–50 kV, EHV = 50–132 kV.
Bulgaria, Croatia, Germany, Greece and Latvia only include low and medium voltage in their SAIDI and SAIFI values.
Finland only includes medium voltage in their unplanned SAIDI and SAIFI.
As of 2016, France does not include medium and low voltage in their unplanned SAIFI.
Ireland, Romania and Sweden do not include extra high voltage in their data.
In Malta, planned and unplanned SAIDI (including exceptional events) values show interruptions at 11 kV or above. The same applies to planned and unplanned SAIFI (including exceptional events).
In the Netherlands, the data provided for SAIDI/SAIFI take into account all interruptions longer than 5 seconds.
In Norway, low voltage interruptions have only been registered since 2014.
In Poland, low voltage is not included in SAIDI.
In Portugal, overall SAIDI and SAIFI only include low voltage.
In Slovenia, unplanned SAIDI and SAIFI without exceptional events only include interruptions on EHV and HV levels. Indicators such as planned/unplanned SAIDI and SAIFI including all interruptions only refer to medium voltage.
Romania, a clear tendency for improvement
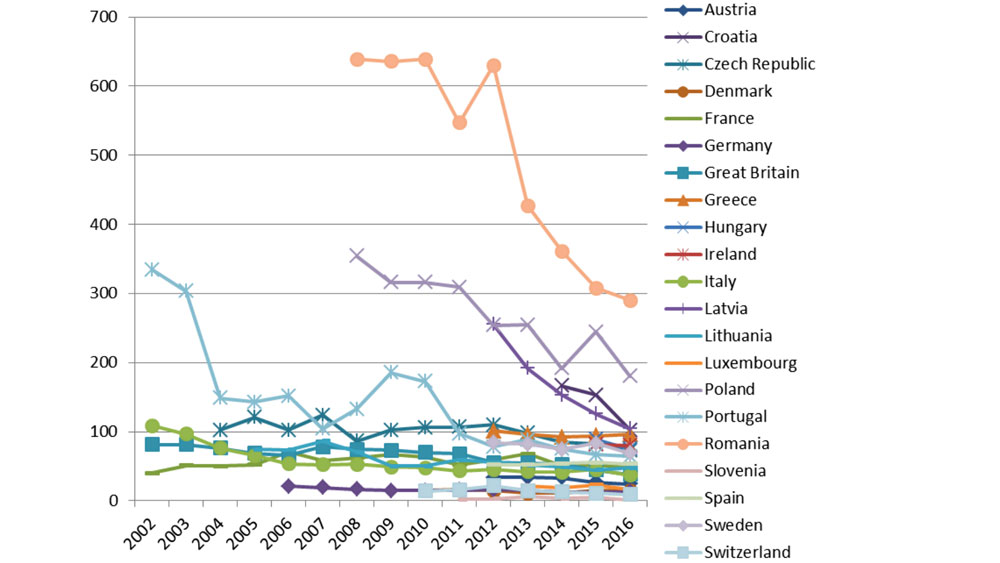
The figure shows the SAIDI for unplanned interruptions with the exception of interruptions caused by exceptional events. For most countries, the 2016 values are at the bottom of their seven-year range showing tendency for improvement.
The SAIDI values for Romania in 2016 shows a steep decline from 2012, demonstrating a clear tendency for improvement. However, Romania has the highest SAIDI values.
As already mentioned, indicators are not always calculated the same way in every country.