
Europe Getting 15% of its Electricity from Wind in 2019
According to the Wind Energy in Europe 2019 report, Europe installed 15.4 GW of new wind energy last year. Three quarters of this was onshore wind, 11.8 GW, new offshore wind was 3.6 GW. Europe now has 205 GW of wind energy. And it accounted for 15% of all electricity consumption in Europe last year.
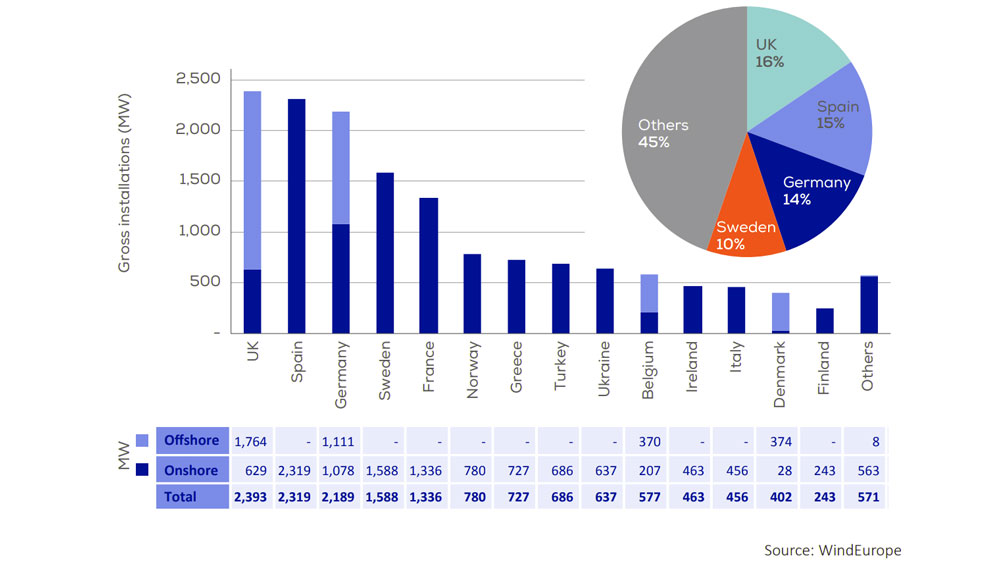
The United Kingdom (2.4 GW, both onshore and offshore) installed the newest wind farms. Then came Spain (2.3 GW, all of it onshore), then Germany (2.2GW, both onshore and offshore), followed by Sweden (1.6 GW, all onshore) and France (1.3 GW, also onshore).
Germany which has long been the engine of the wind industry in Europe is at a standstill. It only installed 1.1 GW of onshore wind last year — its lowest since 2000. And they announced very few new investments, indicating that next year won’t be much better.
Across Europe there were EUR 19bn of new investments announced in wind farms, covering 11.8 GW of capacity. And 15 GW of new capacity was awarded in government auctions and tenders.
2019 installations were up 27% compared to 2018 but the rate of installations needs to double to reach the goals set out in the Green Deal.
Low installation figures in Germany were partly offset by other countries. Spain is back big time — after a number of years with lower installations the country reached its highest rate of installation since 2009. Sweden also reached a record number of installations last year.
In France challenging weather conditions and administrative delays have slowed down the construction of new wind farms. But the industry is ready to deliver on the pace set out in France’s Energy Plan.
“Wind was 15% of Europe’s electricity. But Europe is not building enough new wind farms to deliver the EU’s goal that it should be half of Europe’s electricity by 2050,” WindEurope CEO Giles Dickson said. “Climate neutrality and the Green Deal require Europe to install over twice as much new wind energy each year as it managed in 2019. And the growth needs to come from both offshore and onshore wind.”
“That requires a new approach to planning and permitting and continued investment in power grids. The National Energy and Climate Plans for 2030 are crucial here. The EU needs to ensure they’re ambitious and rigorously implemented,” he also noted.
Cumulative wind power installations
205 GW of wind power capacity is now installed in Europe. 89% of this is onshore. 11% of it is offshore. Germany remains the country with the largest installed capacity in Europe, followed by Spain, the UK, France and Italy.

Five other countries (Sweden, Turkey, Denmark, Poland and Portugal) have more than 5 GW installed. Five more countries have over 3 GW of installed capacity: the Netherlands, Ireland, Belgium, Austria and Romania.
In the EU-28 installed capacity reached 192 GW. EU-27 now have 169 GW of installed wind capacity.
67% of all wind power capacity in Europe is in 5 countries: Germany (61 GW), Spain (26 GW), the UK (24 GW), France (17 GW), and Italy (11 GW). Sweden, Turkey and Poland follow with 9 GW, 8 GW and 6 GW respectively.
Decommissioning and repowering of wind farms
In 2019 only 178 MW of wind power was decommissioned, down from 451 MW in 2018. Germany decommissioned 97 MW, Austria 32 MW, Denmark 32 MW, the UK 17 MW and France 0.2 MW. Nearly all of the decommissioned capacity was onshore (174 MW) and 4 MW were offshore.
Of the 11.7 GW of new onshore wind installed in 2019, only 185 MW were repowering projects. This comes from projects decommissioned in 2018 and 2019. The majority came from Germany, but there was also repowering in Austria, Greece and the UK. Lack of regulatory support, complex permitting rules and high wholesale electricity prices were the main reasons for low market activity in decommissioning and repowering.
Wind power generation
In 2019 wind energy generated enough electricity to meet 15% of the EU’s electricity demand. This is one percentage point higher than 2018 and results from the new installations as well as windy conditions around Europe throughout 2019.
Denmark had the highest share of wind in its electricity mix (48%), followed by Ireland (33%), Portugal (27%) and Germany (26%). 12 Member States had a wind share above 10%.
Europe’s wind farms produced a stable output throughout the year with a daily peak production12 of 102 GW registered on 13 March.
Capacity factors of the EU’s fleet of wind farms were on average 26%. Average capacity factors for onshore wind were 24% and for offshore wind were 38%. These numbers are relatively low as they represent the performance of the entire wind fleet, including very old wind farms. The latter tend to have turbines with relatively small rotors (short blades). Modern turbines have larger blades and can generate power at lower wind speeds, increasing their capacity factors. Capacity factors for new onshore wind farms are 30-35%. For new offshore wind farms, they range between 35% and 55%.
Wind energy production is variable. The hourly variability follows a clear patter throughout the year. March was the month with the highest average hourly generation. 90% of the time in March wind energy generated more than 34 GW of electricity an hour in the EU.
Over June to August the amount of electricity produced by wind energy was lower.
Wind energy generation peaked in the winter months, although in the winter the variation in hourly generation is also higher than in summer.
Wind turbine size
The size and type of wind turbines installed in Europe varied significantly between countries. On average, the most powerful onshore wind turbines were installed in Finland, with an average rating of 4.3 MW. Greece had the lowest average power rating, at 2.3 MW. Based on the available data from 14 countries, the weighted average power rating of onshore turbines was 3.1 MW.
In 2019 the average rated capacity of newly installed offshore turbines was 7.2 MW, up from 6.8 MW in 2018. Belgium and Portugal had the highest average power rating of 8.4 MW. The V164-8.4 MW from MHI Vestas Offshore Wind, with a rotor diameter of 164m, was installed in Deutsche Bucht (Germany) and Norther (Belgium). In Portugal the V164-8.4 MW was used at the Windfloat Atlantic floating offshore wind farm.
The largest turbine in the world is GE’s Haliade-X, the industry’s first 12 MW turbine. The first prototype was installed at the Port of Rotterdam in 2019 (onshore) for testing. Its commercialisation is expected in 2021.
Auctions and tenders in 2019
In 2019 11 countries held renewable energy auctions in which wind energy won, and the total new wind volumes secured were 15.4 GW. Onshore wind secured 8.6 GW and offshore 6.8 GW. It is hard to compare auction results between different countries due to differences between support mechanisms and their length, as well as the maturity of markets, and conditions surrounding the auctions such as cost of capital (WACC), permitting and other sources of revenue or risks for developers.
Nevertheless, several auction results were notable: Poland held Europe’s largest onshore wind auction, awarding 2.2 GW of capacity at an average price of €49/MWh. In the UK the latest auction round awarded more than 5.7 GW, with 5.5 GW of offshore capacity at an average price of £40.63/MWh (€46.16/MWh)15 including grid-connection.
In Germany five out of the six onshore wind auctions held in 2019 were undersubscribed. Only 1.8 GW out of the offered 3.7 GW were awarded due to difficulties faced by project promoters to gather all the necessary permits.
Investment numbers in 2019
Investments in new wind farms in 2019 were €19bn, a 24% drop on 2018. 11.5 GW of new wind projects reached Final Investment Decision (FID): 10.1 GW in onshore wind and 1.4 GW in offshore wind. This represents the second largest amount of capacity financed in a year, albeit significantly less than the record 16 GW in 2018.
In monetary terms investments were at their lowest since 2013. The €6bn in offshore wind energy investments (€5.5bn for bottom-fix and €0.5bn for floating) was the lowest amount in the last 6 years. However, onshore investments were solid at €13bn. Cost reductions across the industry’s value chain and increased industry competition have made it possible for investors to finance more capacity for less cash.
The geographical spread of investments was similar to 2018, with the top 3 investor countries contributing 44% of FID announcements. This compares to 43%, 64% and 73% in 2018, 2017 and in 2016 respectively.
Spain led the way with investments in new wind energy assets in 2019 generating total financing activity of €2.8bn, supporting the construction of 2.8 GW of new onshore wind farms.
France was the largest investor in offshore wind in 2019, with €2.4bn for the finance of a single offshore wind farm, EDF’s 480 MW Saint-Naizaire. The UK was the second largest investor in offshore wind, raising €2.3bn for the financing of the Neart na Gaoithe wind farm, also to be developed by EDF.
Sweden raised €2.3bn for the construction of 2 GW of onshore wind farms.
Investment in Germany reached a record low of €300m, raising capital for a mere 180 MW of onshore wind projects.
Investments in non-EU countries totalled €3.9bn, representing 21% of total investments. Outside the EU, Turkey, Norway and Ukraine led the investments, mostly in onshore wind.