
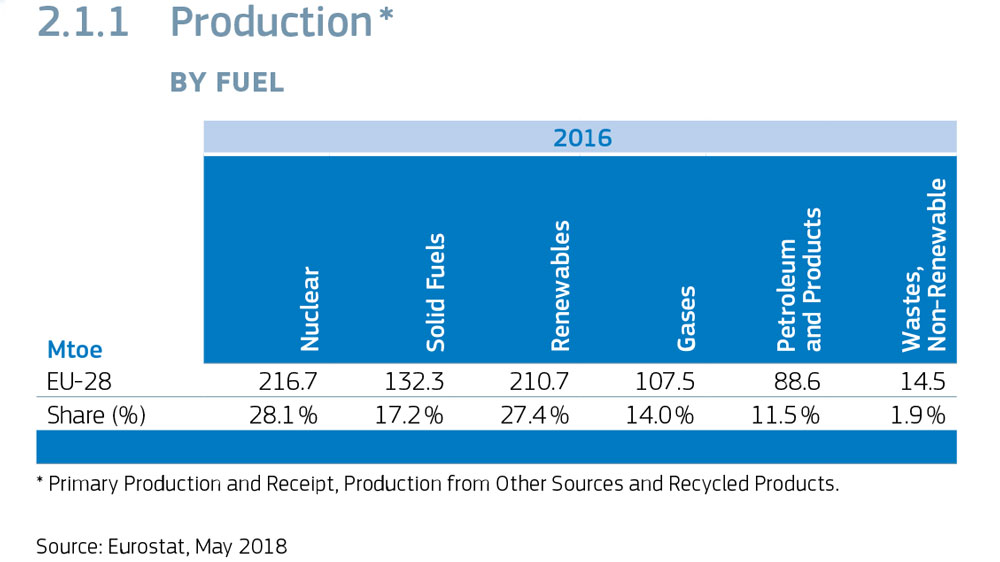
Leading source of electricity generation in the EU
Did you know that renewables are currently the leading source of electricity generation in the EU? And that in the years 1995-2016, the amount of solar and wind energy capacity increased 100 times?
This information and much more is available in the latest EU energy statistical pocketbook (2018 version). It provides energy statistics for all EU countries and the EU as a whole, covering areas including energy production and consumption, socio-economic indicators, and the impact of the energy sector on the environment. You can also find an energy profile for each EU country as well as details of each country’s progress towards the EU’s 2020 climate and energy targets.
The statistical pocketbook 2018 is available online, and the printed version will be available soon.
| Electricity Production | 1995 | 1998 | 2001 | 2004 | 2007 | 2010 | 2013 | 2014 | 2015 | 2016 |
| Gross Electricity Generation, by Fuel – TWh | 2,743.6 | 2,922.7 | 3,119.2 | 3,302.8 | 3,384.1 | 3,366.6 | 3,270.9 | 3,191.2 | 3,235.2 | 3,255.1 |
| Solid Fuels | 945.9 | 911.1 | 940.6 | 985.4 | 986.3 | 829.2 | 874.5 | 807.9 | 791.8 | 701.3 |
| Petroleum and Products 2 | 230.3 | 220.4 | 174.2 | 148.5 | 115.1 | 86.9 | 61.2 | 58.0 | 61.0 | 59.5 |
| Gases | 294.4 | 425.3 | 530.0 | 652.4 | 776.9 | 799.4 | 543.9 | 491.0 | 530.3 | 642.3 |
| Nuclear | 880.8 | 932.9 | 979.0 | 1,008.4 | 935.3 | 916.6 | 876.8 | 876.3 | 857.1 | 839.7 |
| Renewables | 382.6 | 419.5 | 476.9 | 488.5 | 549.7 | 710.8 | 889.3 | 931.2 | 965.7 | 981.5 |
| Hydro | 353.0 | 374.2 | 408.5 | 362.8 | 347.8 | 408.0 | 403.1 | 406.4 | 371.2 | 380.2 |
| of which pumped hydro | 21.0 | 24.8 | 29.3 | 33.8 | 33.4 | 31.1 | 31.5 | 31.4 | 30.1 | 30.1 |
| Wind | 4.1 | 11.3 | 26.7 | 58.9 | 104.4 | 149.4 | 236.8 | 253.1 | 301.9 | 302.9 |
| Biomass and Renewable Wastes | 21.4 | 29.1 | 36.4 | 60.1 | 87.5 | 124.1 | 157.4 | 167.2 | 177.8 | 180.5 |
| Solar | 0.0 | 0.1 | 0.2 | 0.7 | 3.8 | 23.3 | 85.7 | 97.8 | 107.9 | 110.8 |
| Geothermal | 3.5 | 4.3 | 4.6 | 5.5 | 5.8 | 5.6 | 5.9 | 6.2 | 6.5 | 6.6 |
| Tide, Wave and Ocean | 0.5 | 0.5 | 0.5 | 0.5 | 0.5 | 0.5 | 0.4 | 0.5 | 0.5 | 0.5 |
| Wastes non-RES | 8.7 | 12.0 | 16.8 | 12.6 | 16.2 | 19.0 | 20.4 | 21.9 | 23.1 | 25.9 |
| Other | 0.9 | 1.5 | 1.7 | 7.0 | 4.7 | 4.6 | 4.7 | 4.9 | 6.1 | 5.0 |
Statistical pocketbook 2018
The energy sector is one of the pillars of growth, competitiveness and development for modern economies. To keep up with the ongoing transformation of the energy sector in Europe, we need data that is accurate and up-to-date. This publication provides an overview of the most relevant annual energy related statistics for the European Union as a whole and for each of its Member States. The data contained in this pocketbook is drawn from several sources: from the European Commission’s services, from international organizations such as the European Environment Agency and the International Energy Agency and also from the European Commission’s estimates when other data is unavailable. The publication is divided into five parts:
- Part 1. Energy overview at global and EU levels.
- Part 2. Main energy indicators, at EU and Member States levels.
- Part 3. Socio-economic indicators in the EU.
- Part 4. Impact of the energy sector on the environment.
- Part 5. Country profiles – Main energy indicators.
World final energy consumption
According to data most of the world final energy consumption (2016) is covered by petroleum & petroleum products (40.9%), electricity (18.8%) and gas (15.1%). Renewables account for 11.3%, followed by solid fuels (10.8%) and heat (3.0%).
Indicators have been calculated using the methodology established by the European Commission – DG Energy. The appendices include a glossary and methodological notes.
This publication was produced using the most recently available data. Corrections and updates will be published at: https://ec.europa.eu/energy/en/data-analysis

Sources of data / download date:
1 Eurostat energy statistics and population- May 2018;
2 Eurostat SHARES2016 – Jan 2018
3 Eurostat electricity and gas market surveys -May 2018
4 Eurostat CHP survey – July 2018
5 ECFIN-AMECO GDP – May 2018
6 EEA/UNFCCC – June 2018

For more detailed info and updates please consult Eurostat online database at: http://ec.europa.eu/eurostat/data/database
For updates or more detailed CO2/GHG emissions data please consult EEA/UNFCCC at: https://www.eea.europa.eu/data-and-maps/data/national-emissions-reported-to-the-unfccc-and-to-the-eu-greenhouse-gas-monitoring-mechanism-14