

Cleanest Countries in the European Union
Deindustrialization Process in Romania: Pollution versus Production
Romania is one of the cleanest countries in the European Union, the level of greenhouse gas emissions falling to 116.5 million tons of carbon dioxide equivalent (MtCO2e). While in the industrialized countries the reduction of polluting emissions came as an effect of environmental investments starting with 1990, in Romania it is the effect of the deindustrialization process. Nevertheless, the EU statistics show that for each euro produced in Romania 569 grams of CO2e are emitted, one of the largest quantities in the Community space. Overall, after Germany and the United Kingdom, Romania recorded the largest reduction in pollution after 1990, according to a recent report published by the European Environment Agency, which analyses the period 1990-2018.
Cleanest countries in the European Union
With only 6 tons of CO2e/capita, Romania is next to Croatia, also with 6 tons, and Malta, with 5.5 tons, the cleanest countries, the quoted report shows. Compared to 1990, the pollution inhaled by every Romanian had decreased in 2018 by 17.4%. As a percentage, the largest reductions were registered by Denmark (33.8%), Finland (32.8%) and Sweden (31.4%).
While for every euro produced, Romania emits 569 grams of CO2e, Bulgaria emits 1,045 gCO2e/euro, Poland – 836 gCO2e/euro and the Czech Republic – 623 gCO2e/euro. At the same time, Europe’s major economies manage to have the lowest emission intensity values. EU statistics show that Germany emits 266 grams of greenhouse gases for every euro produced, France – 197, Italy – 249, Spain – 293 etc.
Another indicator taken into account by the analysis of the European Environment Agency is the amount of greenhouse gases emitted to achieve the Gross Domestic Product (GDP), relative to the standard purchasing power (SPP). In this respect, with 104 SPP at a GDP of 241 billion dollars, Romania is above the EU average, which shows that we pollute more than we produce. For example, countries with a much higher GDP than that of Romania have a much better situation. Thus, Germany, at a GDP of 3.948 billion dollars, registers 100 SPP, France, at a GDP of 2.778 billion dollars, has 76, and Italy, at a GDP of 2.080 billion dollars, has 86. The worst in this indicator are doing Estonia – 214, Bulgaria – 187 and Poland – 175.
The year of the largest reduction in greenhouse gas emissions
The EU reduced its greenhouse gas (GHG) emissions again in 2018, to reach the lowest level since 1990. Total GHG emissions decreased by 23.2% and stood at 4392 million tonnes of carbon dioxide equivalent (MtCO2e) for the EU-27 plus the United Kingdom in 2018. The figure for the EU without the UK would be 20.7% over the 28-year period. The EU accounted for less than 8% of global GHG emissions in 2018, compared with 15% in 1990. The average EU citizen emitted 8.9 tonnes of CO2e (tCO2e), down from 12.2 tCO2e in 1990, and the total GHG intensity of the EU economy more than halved during the period. The EU emitted 277 grams of CO2 (gCO2e) for each Euro generated in the economy in 2018, compared with 582 gCO2 per Euro in 1990. GHG emissions decreased in the majority of sectors between 1990 and 2018, and particularly in energy supply, industry and the residential sector. When allocating emissions from the energy supply sector to final end users, sectoral emission trends confirm that the largest energy-related emission reductions took place in industry and the residential sector. Emissions from agriculture and waste management have also contributed to the positive trend since 1990. Emissions from road transportation increased, both for passengers and freight transport, in spite of climate policies and the deployment of less carbon intensive and more efficient vehicles on the market.
The reduction in GHG emissions since 1990 can be attributed to a combination of economic factors and the implementation of policies and measures. These include improvements in the carbon intensity of energy production and consumption resulting from the strong uptake of renewables and the switch to less carbon intensive fossil fuels, as well as improvements in the gross energy intensity of the economy, triggered by better energy efficiency, both in transformation and end use. Despite these positive trends, fossil fuels are still the largest source of energy and emissions in the EU. Decarbonising the EU economy will require substantial additional GHG emission reductions in the next 30 years if the EU is to become a climate neutral economy by 2050. The effort required to achieve net-zero emissions by 2050 could imply a tripling of the mitigation efforts achieved to date, in a sustained manner, over the next 30 years.
Results from the EU greenhouse gas inventory for 2018
The latest GHG inventory prepared by the EU and submitted to the United Nations Framework Convention on Climate Change (UNFCCC) shows that, in 2018, total GHG emissions (excluding land use, land use change and forestry -LULUCF) decreased by 92.6 million tonnes or 2.1% compared to 2017, to reach 4 392 MtCO2e in 2018. This decrease in emissions came with an increase in GDP of 2.0 %. Germany and France accounted for more than half of the net reduction in GHG emissions in absolute terms in the EU in 2018. The decrease without the UK was 83.6 million tonnes, to reach 3 893 MtCO2e in 2018.
At the EU level, two thirds of the net reduction in GHG emissions in 2018 took place in main activity producers of heat and electricity, including combined heat and power. Emissions from the combustion of solid fuels for power generation decreased by almost 50 million tonnes in 2018 compared with 2017. Natural gas input to power stations also decreased, with emission levels 14 million tonnes below those of 2017. In addition, the use of renewable energy sources in electricity generation increased again in 2018, thus underpinning the ongoing decarbonisation trend in the sector.


Although less substantially than in the power sector, in 2018 GHG emissions also decreased in residential buildings, refrigeration and air conditioning, petroleum refining and agricultural soils. In particular, HFC emissions from refrigeration and air conditioning decreased for the fourth consecutive year since 2014. Carbon dioxide emissions from road transport remained broadly stable in 2018, compared with 2017, after four consecutive years of increases since 2013. This was a result of lower diesel consumption in passenger cars, where emissions decreased for the first time since 2012. The overall 2.1% net decrease in total GHG emissions in 2018 was partly offset by higher emissions from manufacturing industries and construction.
In terms of fuels, there was a significant decrease in the use of fossil fuels in the energy sector – particularly solid fuels, but also gaseous (natural gas) and liquid fossil fuels. Based on Eurostat data, there was a decline in nuclear energy in 2018, in parallel with a strong increase in the use of renewable energy sources, both in terms of primary and final energy.
Overall, the energy intensity of the economy and the carbon intensity of energy production and consumption decreased again in 2018. These were largely driven by lower transformation losses and better energy efficiency on the one hand, and by the higher share of renewables in the fuel mix, compared to fossil fuels, on the other.
In the past 28 years, total GHG emissions in the EU-27 plus the United Kingdom decreased by 1330 million tonnes of CO2e. The block emitted 4 392 million tonnes of CO2e in 2018 – the lowest level since GHG inventory reporting to the UNFCCC – which is 23.2 % less than in 1990. The total reduction, including international navigation emissions, which are not included in the EU’s current emission targets, over the 28-year period was 1291 million tonnes of CO2e or 22.1 % less than 1990 emission levels.
Country comparison – climate mitigation variables and indicators by country – Evolution of pollutant emissions in the EU since 1990
| Total GHG emissions in 2018 (MtCO2e) | Change in total GHG emissions, 1990-2018 (MtCO2e) | Change in total GHG emissions, 1990-2018 (percentage change) | GHG emissions per GDP in 2018 (PPS, EU=100) | GHG intensity of the economy in 2018 (gCO2e per Euro) | GHG emissions per capita in 2018 (tCO2e per person) | Change in the carbon intensity of energy 1990-2018 (percentage change) | Change in the energy intensity of the economy 1990-2018 (percentage change) | |
| Austria | 81.5 | 2.1 | 2.7 % | 83 | 211 | 9.2 | -20.6 % | -21.1 % |
| Belgium | 123.6 | -25.9 | -17.3 % | 105 | 269 | 10.8 | -24.3 % | -32.2 % |
| Bulgaria | 58.6 | -43.9 | -42.8 % | 187 | 1045 | 8.3 | -13.2 % | -54.7 % |
| Croatia | 24.4 | -8.0 | -24.8 % | 108 | 472 | 6.0 | -15.1 % | -24.3 % |
| Cyprus | 9.9 | 3.4 | 53.8 % | 145 | 466 | 11.3 | -1.5 % | -30.8 % |
| Czechia | 129.4 | -70.2 | -35.2 % | 153 | 623 | 12.2 | -30.4 % | -49.7 % |
| Denmark | 51.3 | -21.3 | -29.3 % | 79 | 170 | 8.9 | -33.8 % | -36.6 % |
| Estonia | 20.2 | -20.2 | -50.0 % | 214 | 775 | 15.3 | -25.3 % | -63.4 % |
| Finland | 58.8 | -13.4 | -18.6 % | 110 | 252 | 10.7 | -32.8 % | -24.8 % |
| France | 462.8 | -94.1 | -16.9 % | 76 | 197 | 6.9 | -24.8 % | -27.2 % |
| Germany | 888.7 | -372.9 | -29.6 % | 100 | 266 | 10.7 | -19.1 % | -42.2 % |
| Greece | 96.1 | -9.7 | -9.2 % | 150 | 520 | 9.0 | -16.0 % | -16.7 % |
| Hungary | 64.1 | -30.4 | -32.2 % | 106 | 479 | 6.6 | -26.7 % | -41.8 % |
| Ireland | 64.2 | 7.7 | 13.6 % | 80 | 198 | 13.2 | -13.9 % | -67.0 % |
| Italy | 439.3 | -81.1 | -15.6 % | 86 | 249 | 7.3 | -21.5 % | -12.9 % |
| Latvia | 12.2 | -14.4 | -54.1 % | 105 | 420 | 6.3 | -30.7 % | -53.7 % |
| Lithuania | 20.6 | -27.8 | -57.4 % | 105 | 456 | 7.4 | -20.7 % | -68.9 % |
| Luxembourg | 12.4 | -0.8 | -5.8 % | 89 | 206 | 20.3 | -20.4 % | -52.0 % |
| Malta | 2.7 | -0.1 | -3.9 % | 64 | 215 | 5.5 | -29.4 % | -65.7 % |
| Netherlands | 200.5 | -25.8 | -11.4 % | 103 | 259 | 11.6 | -9.2 % | -36.4 % |
| Poland | 415.9 | -59.9 | -12.6 % | 175 | 836 | 11.0 | -12.8 % | -63.1 % |
| Portugal | 71.6 | 11.4 | 18.9 % | 103 | 350 | 7.0 | -10.4 % | -7.2 % |
| Romania | 116.5 | -132.3 | -53.2 % | 104 | 569 | 6.0 | -17.4 % | -70.9 % |
| Slovakia | 43.5 | -30.1 | -40.8 % | 125 | 485 | 8.0 | -34.6 % | -65.2 % |
| Slovenia | 17.6 | -1.1 | -5.7 % | 112 | 385 | 8.5 | -18.6 % | -33.2 % |
| Spain | 352.2 | 58.1 | 19.7 % | 95 | 293 | 7.5 | -15.6 % | -16.1 % |
| Sweden | 54.6 | -17.9 | -24.7 % | 51 | 116 | 5.4 | -31.4 % | -41.9 % |
| United Kingdom | 498.7 | -311.0 | -38.4 % | 81 | 206 | 7.5 | -25.5 % | -50.1 % |
| EU-27 plus United Kingdom | 4 391.8 | -1 329.5 | -23.2 % | 97 | 276 | 8.6 | -21.8 % | -38.4 % |
| European Union | 3 893.1 | -1 018.5 | -20.7 % | 100 | 289 | 8.7 | -21.1 % | -36.2 % |
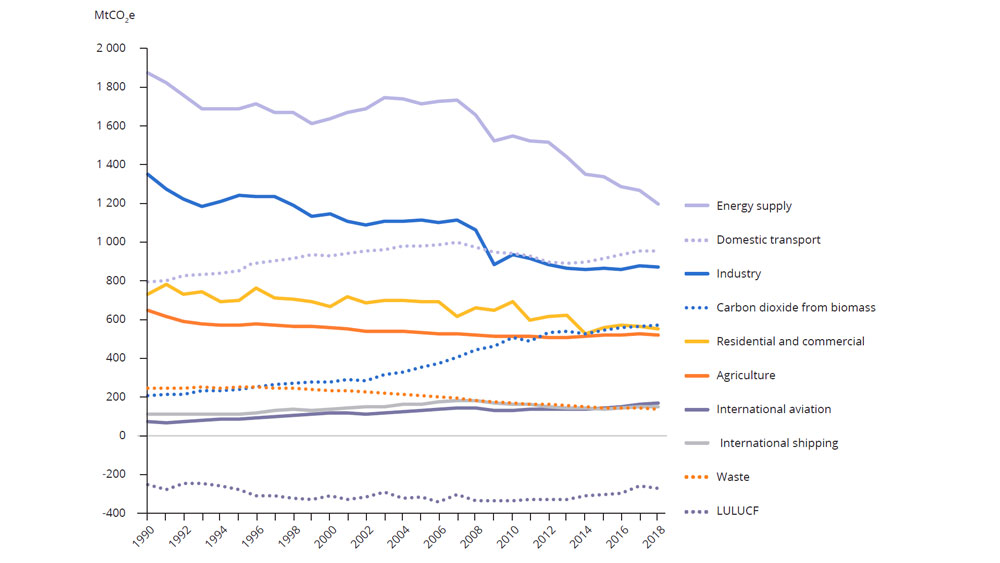
Emission trends by sector in greenhouse gas inventories
GHG emissions decreased in the majority of sectors between 1990 and 2018, with the exception of transportation. The largest decrease in emissions in absolute terms occurred in energy supply and industry, although agriculture, residential and commercial (i.e. buildings), and waste management have all contributed to the positive trend in GHG emissions since 1990. The figure also shows the increase in CO2 emissions from bioenergy combustion. Although net removals from LULUCF increased over the period, the strong increase in CO2 emissions from bioenergy highlights the rapidly increasing importance of bioenergy in replacing fossil fuel sources in the EU.
At the level of key emission sources reported in GHG inventories, the largest emission reductions took place in the manufacturing industries and construction, electricity and heat production, iron and steel production, and residential sectors. The largest decrease in emissions in relative terms occurred in waste management, through reduced and better controlled landfilling. Emissions from HFCs (until recently) and road transport increased substantially over the 28-year period. International transport emissions have also increased significantly since 1990.
In terms of the main GHGs, CO2 reductions contributed most to the reduction in emissions since 1990. Reductions in emissions from nitrous oxide (N2O) and CH4 have been substantial, reflecting inter alia:
- For CH4: lower levels of mining activities, improvements in technology and pipeline networks, lower agricultural livestock and enteric fermentation from cattle, lower emissions from managed biodegradable waste disposal on land and intensified separate collection, recycling and landfill-gas recovery;
For N2O: reduced adipic and nitric acid production.
Although N2O emissions from agricultural soils have decreased over the 28-year period, recent years have seen an increase in these emissions at the EU level, mostly due to the intensified use of inorganic fertilisers on cropland and grassland.
A combination of factors explains lower emissions in industrial sectors. These include improved efficiency and carbon intensity as well as structural changes in the economy, with a higher share of services and a lower share of more-energy-intensive industry in total GDP. The economic recession that began in the second half of 2008 and continued into 2009 also had a lasting impact on emissions from industrial sectors. Emissions from electricity and heat production have decreased strongly since 1990. In addition to improved energy efficiency, there has been a move towards less carbon intensive fuels. Between 1990 and 2018, the use of solid and liquid fuels in thermal stations decreased strongly, whereas natural gas consumption doubled, resulting in reduced CO2 emissions per unit of fossil fuel energy generated. Emissions in the residential sector also represented one of the largest reductions at EU level. Energy efficiency improvements from better insulation standards in buildings and a less carbon intensive fuel mix can partly explain lower demand for space heating in the EU as a whole over the past 28 years. Since 1990, there has been, on average, a warming of autumns/winters in Europe, although there is high regional variability.
Change in absolute greenhouse gas emissions in the EU (Kyoto Protocol scope) by key source category, 1990-2018
| Source category | MtCO2e |
| Road transportation (CO2 from 1.A.3.b) | 172 |
| Refrigeration and air conditioning (HFCs from 2.F.1) | 86 |
| Aluminium production (PFCs from 2.C.3) | -21 |
| Cement production (CO2 from 2.A.1) | -25 |
| Agricultural soils: Direct N2O emissions (N2O from 3.D.1) | -25 |
| Fluorochemical production (HFCs from 2.B.9) | -27 |
| Fugitive emissions from oil and natural gas (CH4 from 1.B.2) | -38 |
| Fuels used commercial/institutional sector (CO2 from 1.A.4.a) | -41 |
| Enteric fermentation: Cattle (CH4 from 3.A.1) | -44 |
| Nitric acid production (N2O from 2.B.2) | -46 |
| Adipic acid production (N2O from 2.B.3) | -57 |
| Manufacture of solid fuels and other energy industries (CO2 from 1.A.1.c) | -61 |
| Fugitive emissions from solid fuels (CH4 from 1.B.1) | -68 |
| Managed waste disposal sites (CH4 from 5.A.1) | -72 |
| Iron and steel production (CO2 from 1.A.2.a + 2.C.1) | -115 |
| Fuels used residential sector (CO2 from 1.A.4.b) | -134 |
| Manufacturing industries (excluding iron and steel) (energy-related CO2 from 1.A.2 excl. 1.A.2.a) | -248 |
| Public electricity and heat production (CO2 from 1.A.1.a) | -497 |
| Memo items: | |
| International aviation (CO2 from 1.D.1.a) | 97 |
| International navigation (CO2 from 1.D.1.b) | 38 |
| Totals | |
| Total GHGs [excluding LULUCF, excluding international transport] | -1 425 |
| Total GHGs [excluding LULUCF, including international aviation] | -1 327 |
Economic growth, employment and emission reductions
There has been a substantial improvement in the GHG emissions intensity of the EU economy since 1990. GHG emissions decreased by 23% and GDP increased by 60% between 1990 and 2018. In addition, the population in the EU plus the United Kingdom increased by 35 million between 1990 and 2018. GHG intensities of Member States have both decreased and converged since 1990. One reason for this convergence is the strong growth in the use of renewable energy sources in most Member States and a clear move towards less carbon intensive fuels.
However, the reliance on coal, gas and oil remains high at EU level and the economy continues to be, by and large, based on fossil fuels. It is worth highlighting that EU economies have grown and emissions have decreased alongside a growing share of renewables, less carbon intensive fuels in the energy mix and improvements in energy efficiency. Yet, to break the link between GDP and GHG emissions, more substantial improvements in energy efficiency and carbon intensity will be needed, which will enable the EU to meet its 2030 and 2050 objectives, according to the quoted report.
Effort to meet EU targets and objectives, compared with 1990 emissions (MtCO2e)
| GHG level | Total reduction | Number of years | Annual reduction | |
| Year 1990 | 5 721 | – | – | – |
| Year 2018 | 4 392 | -1 330 | 28 | -47 |
| 2020, 20 % target/1990 | 4 577 | -1 144 | 30 | -38 |
| 2030, 1st NDC 40 % target/1990 | 3 433 | -2 289 | 40 | -57 |
| Meeting the 2030 target taking into account already-achieved (by 2018) reductions | 3 433 | -959 | 12 | -80 |
| 2050 EU objective, between 80 %/1990 | 1 144 | -4 577 | 60 | -76 |
| and 95 %/1990 | 286 | -5 435 | 60 | -91 |
| Meeting the 95 % objective taking into account already-achieved reductions | 286 | -4 106 | 32 | -128 |
| Meeting the objective of climate neutrality by 2050 | Net zero GHG emissions | Net GHG emission reduction also depends on emissions removals | 32 | – |