

UNECE: Nuclear is the Lowest Carbon Electricity Source
A new report by the United Nations Economic Commission for Europe (UNECE) that examined the lifecycle carbon produced by all technologies suggests that nuclear power generates less carbon dioxide emissions over its lifecycle than any other electricity source.
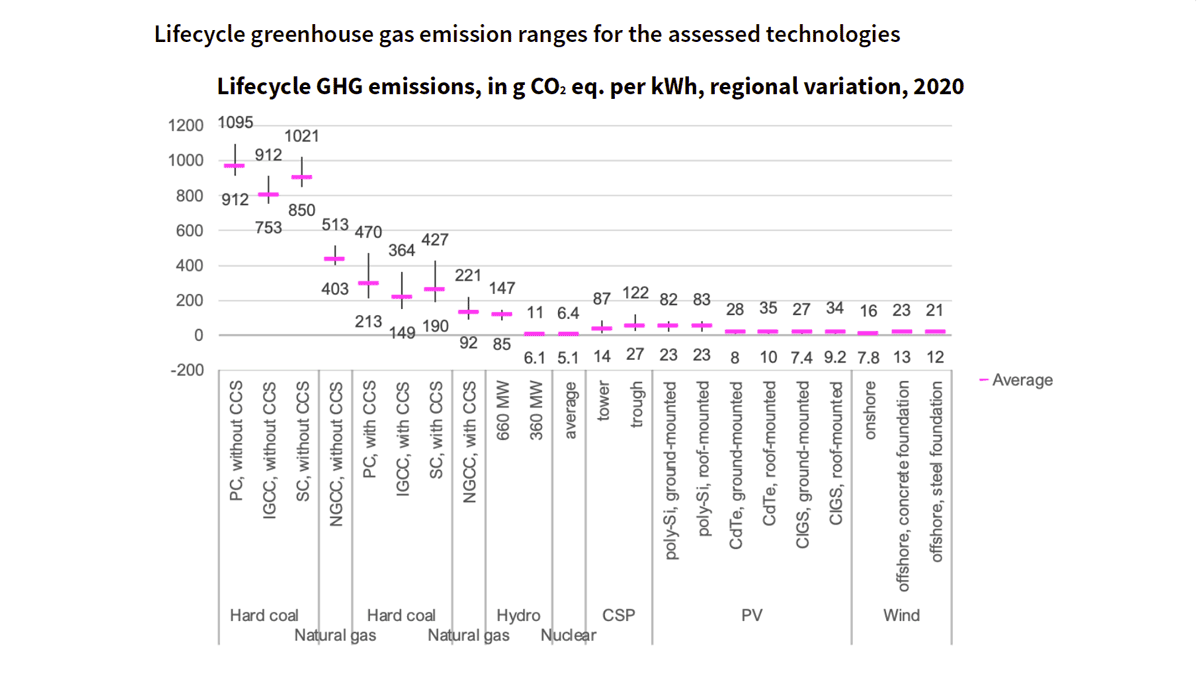
In its analysis of lifecycle greenhouse gas emissions, the commission found that nuclear has the lowest carbon footprint, measured in grams of CO2 equivalent per kilowatt-hour (kWh) of electricity, of any technology.
Candidate technologies assessed include coal, natural gas, hydropower, nuclear power, concentrated solar power (CSP), photovoltaics, and wind power. Twelve global regions included in the assessment, allowing to vary load factors, methane leakage rates, or background grid electricity consumption, among other factors.
- Coal power shows the highest scores, with a minimum of 751 g CO2 eq./kWh (IGCC, USA) and a maximum of 1095 g CO2 eq./kWh (pulverised coal, China). Equipped with a carbon dioxide capture facility, and accounting for the CO2 storage, this score can fall to 147–469 g CO2 eq./kWh (respectively).
- A natural gas combined cycle plant can emit 403–513 g CO2 eq./kWh from a life cycle perspective, and anywhere between 49 and 220 g CO2 eq./kWh with CCS. Both coal and natural gas models include methane leakage at the extraction and transportation (for gas) phases; nonetheless, direct combustion dominates the lifecycle GHG emissions.
- Nuclear power shows less variability because of the limited regionalisation of the model, with 5.1–6.4 g CO2 eq./kWh, the fuel chain (‘front-end’) contributes most to the overall emissions.
- On the renewable side, hydropower shows the most variability, as emissions are highly site-specific, ranging from 6 to 147 g CO2 eq./kWh. As biogenic emissions from sediments accumulating in reservoirs are mostly excluded, it should be noted that they can be very high in tropical areas.
- Solar technologies generate GHG emissions ranging from 27 to 122 g CO2 eq./kWh for CSP, and 8.0–83 g CO2 eq./kWh for photovoltaics, for which thin-film technologies are sensibly lower-carbon than silicon-based PV. The higher range of GHG values for CSP is probably never reached in reality as it requires high solar irradiation to be economically viable (a condition that is not satisfied in Japan or Northern Europe, for instance).
- Wind power GHG emissions vary between 7.8 and 16 g CO2 eq./kWh for onshore, and 12 and 23 g CO2 eq./kWh for offshore turbines.
Most of renewable technologies’ GHG emissions are embodied in infrastructure (up to 99% for photovoltaics), which suggests high variations in lifecycle impacts due to raw material origin, energy mix used for production, transportation modes at various stages of manufacturing and installation, etc. As impacts are embodied in capital, load factor and expected equipment lifetime are naturally highly influential parameters on the final LCA score, which may significantly decrease if infrastructure is more durable than expected.
Ionising radiation occurs mainly due to radioactive emissions from radon 222, a radionuclide present in tailings from uranium mining and milling for nuclear power generation, or coal extraction for coal power generation. Coal power is a potentially significant source of radioactivity, as coal combustion may also release radionuclides such as radon 222 or thorium 230 (highly variable across regions). Growing evidence that other energy technologies emit ionising radiation over their life cycle has been published, but data was not collected for these technologies in this study.
Human toxicity, non-carcinogenic, has been found to be highly correlated with the emissions of arsenic ion linked with the landfilling of mining tailings (of coal, copper), which explains the high score of coal power on this indicator.
Carcinogenic effects are found to be high because of emissions of chromium VI linked with the production of chromium-containing stainless steel – resulting in moderately high score for CSP plants, which require significant quantities of steel in solar field infrastructure relatively to electricity generated.
Technologies: Nuclear power
About 70 designs of SMRs are under development today. There is no strict definition of SMRs, but in practice they include reactors under 300 MW in size, as well as a high degree of modularity, for example, whole reactors can be designed to be transported by truck and installed on any site with minimal preparation. This flexibility theoretically reduces the time of construction and upscaling. Some designs can also follow load, more effectively than conventional nuclear plants and this make SMRs attractive regarding grid integration challenges. Overall, the development of SMRs provides access to nuclear power to countries that cannot accommodate large nuclear power plants for various reasons, be it costs or energy policy planning. It is recognised that deploying SMRs commercially would unlock access to nuclear power in new sectors and regions.


Environmental impact assessment
A life cycle assessment for the NuScale SMR design (Godsey, K., Life Cycle Assessment of Small Modular Reactors Using US Nuclear Fuel Cycle. 2019, Clemson University) finds that per kWh of electrical output, the system would emit 4.6 g CO2 eq./kWh. This is sensibly lower than the value reported previously (Carless, T.S., W.M. Griffin, and P.S. Fischbeck, The environmental competitiveness of small modular reactors: A life cycle study. Energy, 2016), of 8.4 g CO2 eq./kWh. Both reactors being smaller versions of conventional light water reactors, this range of emissions coincides with commonly reported lifecycle GHG emissions of 1000 MW-scale reactors, including the value in this report, 5.6 g CO2 eq./kWh under European (core and backend) conditions.
Main conclusions
The overarching objective of this report is to assess the lifecycle environmental impacts of electricity generation options. This has been performed by performing an LCA on updated life cycle inventories of select technologies.
Specifically, hard coal, natural gas, hydropower, concentrated solar power, photovoltaics, wind power, as well as nuclear, have been evaluated regarding the following indicators: climate change, freshwater eutrophication, ionizing radiation, human toxicity, land occupation, dissipated water, as well as resource use.
Regarding GHG emissions, coal power shows the highest scores, with a minimum of 751 g CO2 eq./kWh (IGCC, USA) and a maximum of 1095 g CO2 eq./kWh (pulverised coal, China). Equipped with a carbon dioxide capture facility, and accounting for the CO2 storage, this score can fall to 147–469 g CO2 eq./kWh (respectively). A natural gas combined cycle plant can emit 403–513 g CO2 eq./kWh from a life cycle perspective, and anywhere between 49 and 220 g CO2 eq./kWh with CCS. Nuclear power shows less variability because of the limited regionalisation of the model, with 5.1–6.4 g CO2 eq./kWh. On the renewable side, hydropower shows the most variability, as emissions are highly site-specific, ranging from 6 to 147 g CO2 eq./kWh. As biogenic emissions from sediments accumulating in reservoirs are mostly excluded, it should be noted that they can be very high in tropical areas. Solar technologies show GHG emissions ranging from 27 to 122 g CO2 eq./kWh for CSP, and 8.0–83 g CO2 eq./kWh for photovoltaics, for which thinfilm technologies are sensibly lower-carbon than silicon-based PV. The higher range of GHG values for CSP is probably never reached in reality as it requires high solar irradiation to be economically viable (a condition that is not satisfied in Japan or Northern Europe, for instance). Wind power GHG emissions fluctuate between 7.8 and 16 g CO2 eq./kWh for onshore, and 12 and 23 g CO2 eq./kWh for offshore turbines.
Most of renewable technologies’ GHG emissions are embodied in infrastructure (up to 99% for photovoltaics), which suggests high variations in lifecycle impacts due to variations in raw material origin, energy mix used for production, the transportation modes at various stages of manufacturing and installation, etc.
All technologies display very low freshwater eutrophication over their life cycles, with the exception of coal, the extraction of which generates tailings that leach phosphate to rivers and groundwater. CCS does not influence these emissions as they occur at the mining phase. Average P emissions from coal range from 600 to 800 g P eq./MWh, which means that coal phase-out would virtually cut eutrophying emissions by a factor 10 (if replaced by PV) or 100 (if replaced by wind, hydro, or nuclear).